In Week 12, the final performance test was ran. The team was given three opportunities to test the AEV, with the best run being accepted as the final run. The code was written based off of the PT2 code. A mix of coastal and power braking was then implemented to conserve energy. Through trial and error, the optimal stopping distance and motor power settings were found and implemented in the code.
Prototype Final Performance Test Code
//reverse all motors to ensure correct direction of movement
reverse(4);
//initialize servo to correct direction
rotateServo(10);
//run all motors until vehicle reaches gate
motorSpeed(4,37);
//goToAbsolutePosition(282);
goToAbsolutePosition(284);
//stop all motors and rotate brake to active position until gate opens
brake(4);
rotateServo(50);
goFor(7);
//return servo to rest position, run motor through gate and stop all motors
rotateServo(10);
//AEV goes to caboose, stops 5 seconds, coasts into caboose then stops
motorSpeed(4,35);
goFor(4);
brake(4);
motorSpeed(4,0);
goToAbsolutePosition(623);
rotateServo(50);
goFor(5);
rotateServo(10);
//motorSpeed(4,35);
//goFor(1);
//brake(4);
//goFor(5);
//reverse all motors to ensure correct direction of movement
reverse(4);
//run all motors until vehicle reaches gate
motorSpeed(4,40);
goToAbsolutePosition(345);
//stop all motors and rotate brake to active position until gate opens
brake(4);
rotateServo(50);
goFor(7);
rotateServo(10);
motorSpeed(4,45);
goToAbsolutePosition(250);
motorSpeed(4,0);
goToAbsolutePosition(10);
brake(4);
rotateServo(50);
goFor(1);
rotateServo(10);
//PT2:
//reverse all motors to ensure correct direction of movement
reverse(4);
//initialize servo to correct direction
rotateServo(0);
//run all motors until vehicle reaches gate
motorSpeed(4,35);
//goToAbsolutePosition(282);
goToAbsolutePosition(288);
//stop all motors and rotate brake to active position until gate opens
brake(4);
rotateServo(20);
goFor(1);
rotateServo(0);
goFor(6);
//return servo to rest position, run motor through gate and stop all motors
//AEV goes to caboose, stops 5 seconds, coasts into caboose then stops
motorSpeed(4,35);
goFor(4);
brake(4);
motorSpeed(4,0);
goToAbsolutePosition(640);
motorSpeed(4,0);
goFor(5);
reverse(4);
motorSpeed(4,30);
goFor(4);
brake(4);
The trial runs ran very smoothly. The braking was consistent and the AEV was able to carry the caboose back into the starting dock. One issue realized was a sharp recoil when braking with the caboose. The speed was reduced to prevent too much recoil, and coastal braking was implemented sooner before the servo engaged. Presented below is the final code from the first run.
Distance vs. Time

The Final Performance Test was successful. All of the commands executed properly, and the caboose was brought into the starting dock with ease and little trouble. The AEV traveled a total of 1320 marks for a total time of 59 seconds.
Velocity vs. Time

The optimized velocity for the final run was 68 marks per second, as evidenced by the most common trend in the velocity vs. time plot. The AEV was able to move at a slower speed before attaching to the caboose, but was required to move at a higher speed, approximately 80 marks per second, when exiting the gate for a second time.
Voltage vs. Time

Voltage levels remained relatively consistent for the majority of the code; 560 volts were primarily used at any given moment. Voltage levels spiked as expected when the servo engaged, as demonstrated by the 4 hills seen on the graph.
Power vs. Time
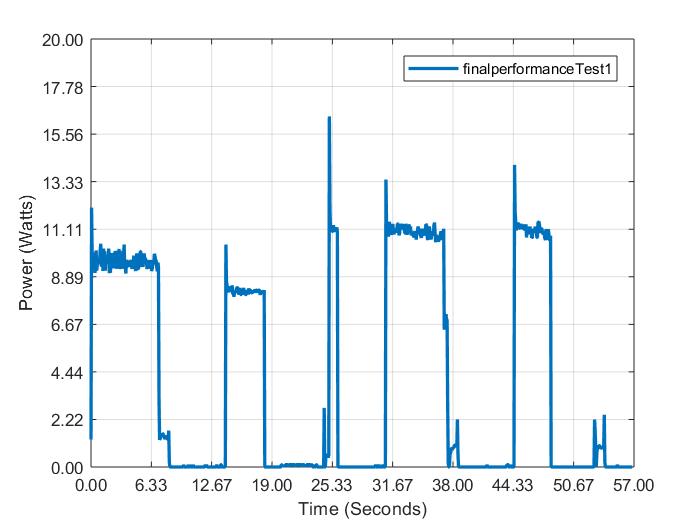
The AEV’s power usage remained consistent much like the voltage plots. Power usage increased around 32 seconds due to having the caboose attached at the back. Furthermore. the usage of coastal braking allowed for lower outputs of power as evidenced by the lines of slope zero along the x axis.
Comparison of All Three Performance Tests

As expected, the final performance test used more power than any of the previous two tests. Power usage increased after the caboose attached, as seen from 25 seconds onward. This can be attributed to the extra weight the caboose added. Despite going twice the distance from PT2, PT3 did not double up on energy. 229 total joules were used compared to the 129 joules from PT2, only a 77.5% increase which was 22.5% less than expected. The final run cost $593,320.00, placing the team at $93 thousand over budget.