Effects of continuous or end-of-day far-red light on tomato plant growth, morphology, light absorption, and fruit production

Citation

Kalaitzoglou, P., W. van Ieperen, J. Harbinson, M. van der Meer, S. Martinakos, K. Weerheim, C.C.S. Nicole, and L.F.M. Marcelis. 2019. Effects of continuous or end-of-day far-red light on tomato plant growth, morphology, light absorption, and fruit production. Frontiers in Plant Science 10: 322 https://doi.org/10.3389/fpls.2019.00322

Background

LEDs are becoming increasingly common in modern controlled environment horticultural systems. The potential energy-savings and flexibility of LEDs makes them attractive lighting options compared to traditional high-pressure sodium or metal halide bulbs. Questions remain regarding the effects of light wavelengths emitted by LEDs on plant growth. Plants respond to differing wavelengths of light by changing physical characteristics and growth. Shading causes a low red light (R) to far-red light (FR) ratio (R:FR), resulting in low levels of the active form of a key plant photoreceptor, phytochrome. This low phytochrome stationary state (PSS) leads to a variety of shade avoidance responses that affect plant morphology and development. In contrast, LEDs used for greenhouse lighting often emit low levels or zero far-red light, causing plants to have higher PSS values than sunlight. Little is known about the effects of changing R:FR ratios on photosynthesis and plant growth in greenhouses using LEDs. Using tomato as a model crop, researchers at Wageningen University investigated how tomato morphology changes in response to higher than sunlight R:FR ratio supplied by LEDs and what effect these changes have on plant light absorption and growth (Kalaitzoglou et al., 2019). In addition, the researchers were interested if a short end-of-day FR treatment (EOD-FR) could compensate for any negative effects of growing plants without FR light during daytime.

Methods

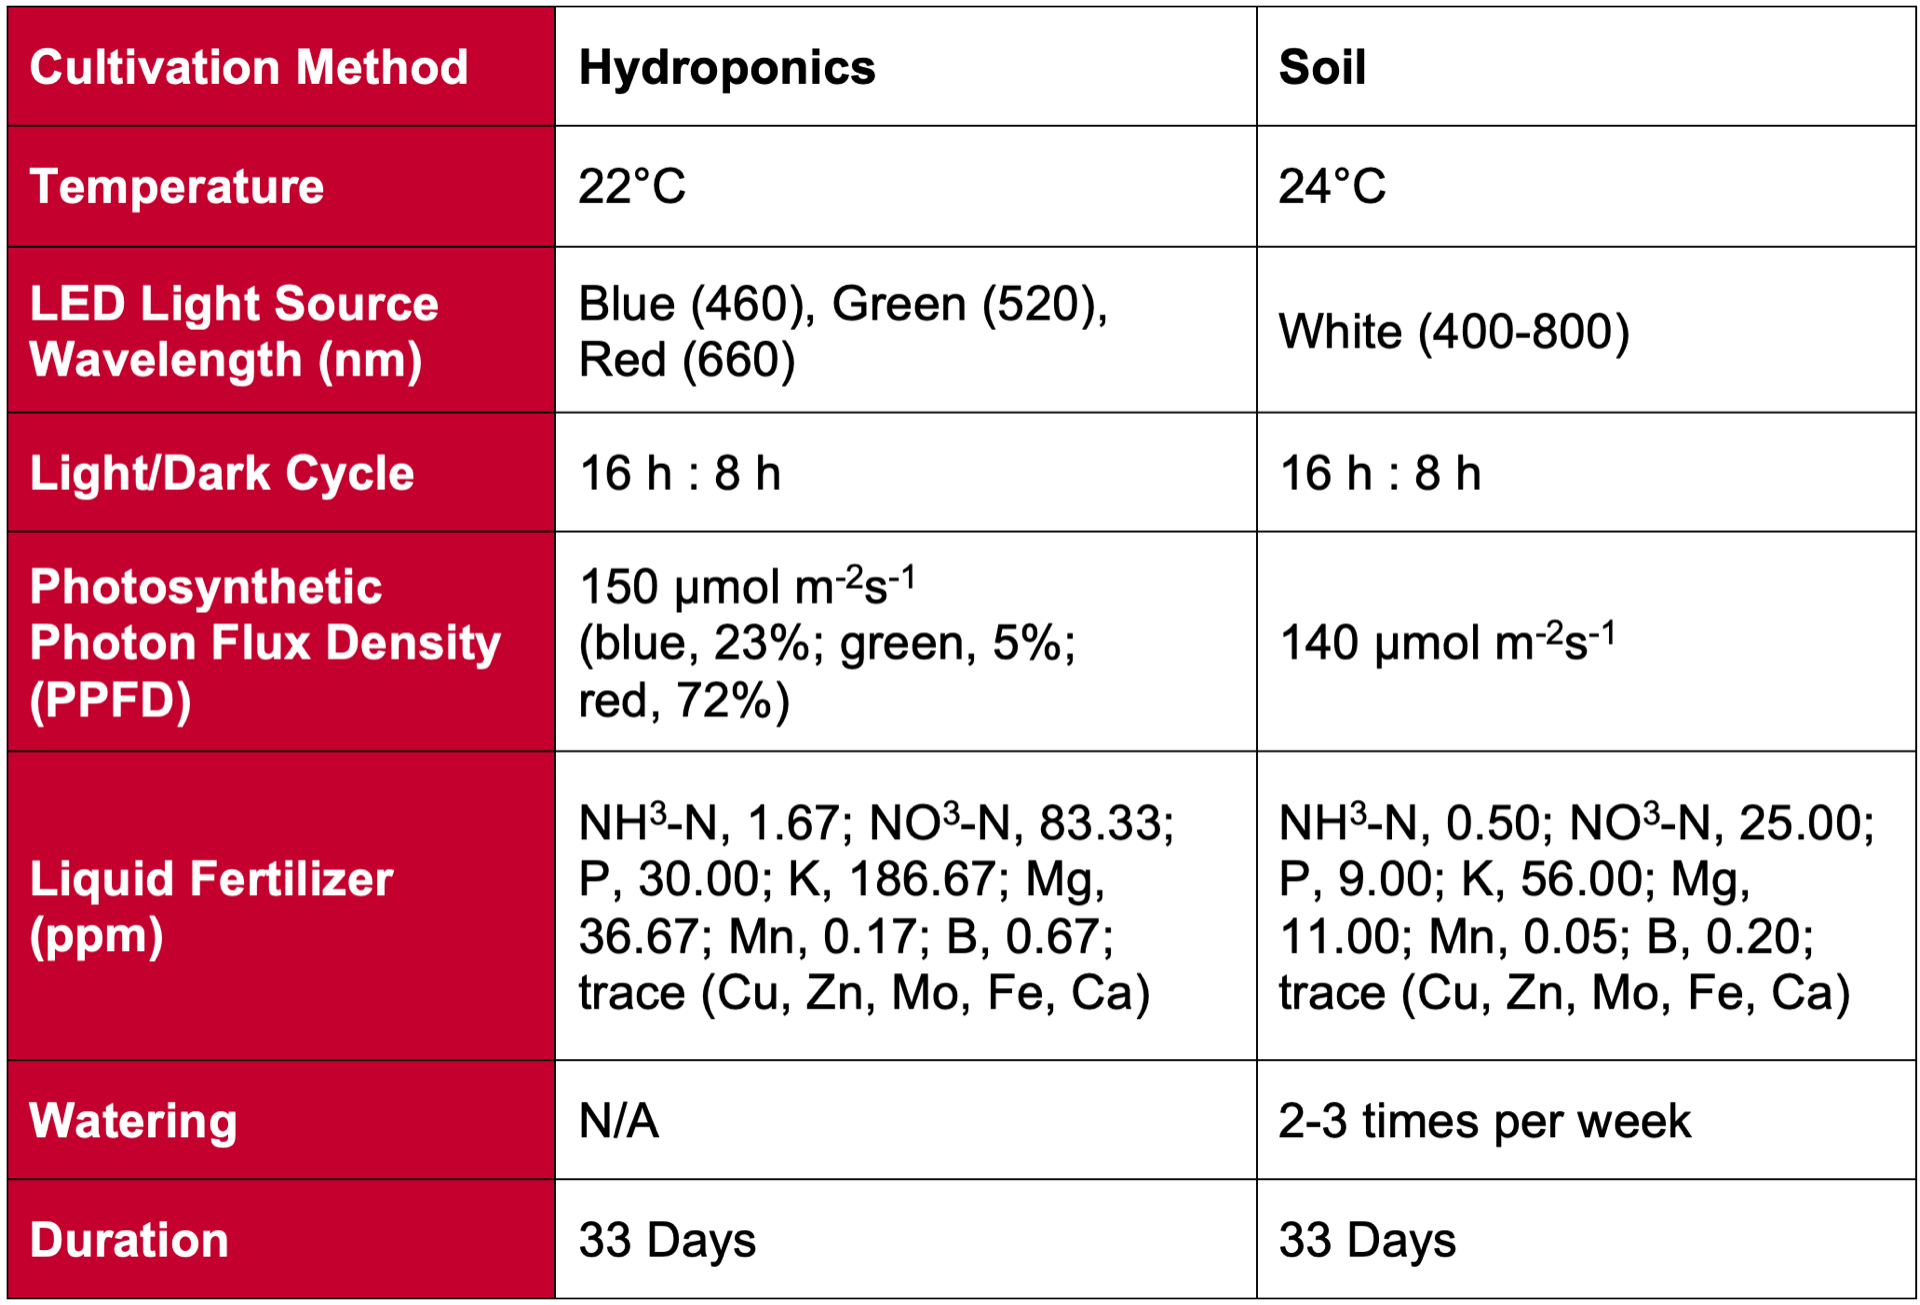
The researchers conducted two experiments (EXP1 & EXP2). In both experiments, greenhouse chambers were divided into 15 equal compartments, each containing 20 tomato plants. Each compartment was illuminated by a combination of red (95%) and blue (5%) LEDs that supplied approximately 150 mmol
m-2 s-1 of photosynthetically active radiation (PAR) over the course of a 16 hour day. Additional FR LEDs were installed to provide five different treatments based on FR intensities. In four treatments, both FR LEDs and red/blue LEDs were on at the same time during the day, resulting in plant PSS values of 0.70, 0.73, 0.80, 0.88. The fifth treatment was a 15 minute end of day FR cycle (EOD-FR) following the end of the photoperiod. To investigate the interaction between the effects of FR and solar radiation on plant morphology the first experiment (EXP1) used a blackout screen to block incoming sunlight, while the second experiment (EXP2) exposed the plants to broadband solar radiation from morning to afternoon. In addition, EXP1 lasted only four weeks after transplanting while EXP2 was extended to 16 weeks to allow for tomato fruit development.

In both experiments, researchers measured plant growth and morphology traits such as plant height, petiole angle, and leaf area. In EXP2, fruit traits including total fruit weight (g/plant), number of fruits, and number of open flowers at 4 weeks were recorded. Additional measured traits included leaf ligh absorbance and chlorophyll and carotenoid content. To simulate light absorption for each treatment, researchers constructed a 3D plant model using GroIMP software (Hemmerling et al., 2008). Researchers used the model to estimate the effects of changes in plant morphology in response to FR light treatments on plant light absorption.

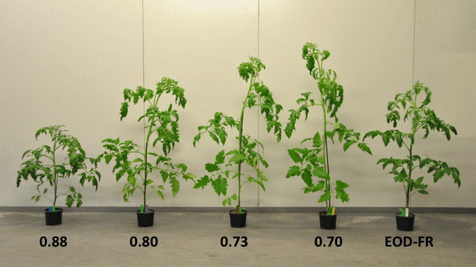
Supplemental Figure S5. (Kalaitzoglou et al., 2019)

Results

Increasing R:FR ratio to levels above sunlight had a negative impact on tomato plant growth. In both experiments, morphological parameters such as plant height and leaf area decreased as PSS values became higher (Supplemental Figure S5). The researchers concluded that lower levels of plant light absorption in high PSS treatments were primarily caused by the decrease in leaf area, ultimately reducing plant growth. Similar results were observed for fruit characteristics in which fruit size and fruit number were greater in treatments with increasing FR compared to the 0.88 PSS treatment (no FR) and EOD-FR treatment. FR treatments also stimulated early flower and fruit maturity. Interestingly, while leaf PAR absorbance and chlorophyll content were lower in low PSS treatments, net photosynthesis was higher. Researchers attributed this result to the Emerson effect in which a higher rate of photosynthesis occurs when plants are exposed to a simultaneous mixture of red and far-red light. In both studies, EOD-FR treatments were not enough to offset the negative effects of growing plants with low levels or zero FR light throughout the day. In conclusion, the results of the study indicated that the presence of FR light increased fruit yield and accelerated flowering and FR LEDs could be a beneficial addition to greenhouses to improve tomato fruit production.

Energy, water and nutrient impacts of California-grown vegetables compared to controlled environmental agriculture systems in Atlanta, GA

Energy, water and nutrient impacts of California-grown vegetables compared to controlled environmental agriculture systems in Atlanta, GA

Steven W. Van Ginkel, Thomas Igou, Yongsheng Chen*School of Civil and Environmental Engineering, Georgia Institute of Technology, 200 Bobby Dodd Way, Atlanta, GA 30332, United States.

Citation

Van Ginkel, S.W., T. Igou, and Y. Chen. 2017. Energy, water and nutrient impacts of California-grown vegetables compared to controlled environmental agriculture systems in Atlanta, GA. Resources, Conservation and Recycling 122:319-325. Https://doi.org/10.1016/j.resconrec.2017.03.003 (Links to an external site.)

 Background

This paper compares the efficiency of California Based traditional vegetable agriculture to hydroponics and aquaponics systems. Efficiency is defined by water usage, energy and nutrient input as it relates to crop yield. California is the leader in fruit and vegetable agriculture; therefore the rest of the United States is reliant on their system. However, California is also susceptible to severe drought, which can lead to reduce yields. Additionally, California has very large watershed, which can cause runoff of fertilizers in ponds, lakes and other bodies of water. Therefore to mitigate the environmental footprint of agriculture production, the author’s suggests that future generations focus on urban agriculture. Aquaponics is a system that allows the production of vegetables and fish, while reducing the input of fertilizers, and using waste byproducts as the source of nutrients. The authors show that this system reduces the nutrient input, water usage and is more productive that traditional based vegetable production. Therefore the purpose of this paper is to compare and contrast the productivity of each system.

 Experimental Design

California vegetable data was derived from www.casestudies.ucdavis.edu. Data was taken for several crops including tomato, spinach, strawberries, peppers, and broccoli. The data displays yield, nutrient input, energy input for each crop. The data was normalized by dividing each component by yield per acre. For hydroponics, there was one grower who grew lettuce and leafy greens in shipping containers. The data was normalized for energy (lighting and cooling) and water usages over a year divided by yield per container. For aquaponics, there were three growers, one from Hawaii and two from University of Virgin Islands and Atlanta, GA. All growers used deep-water culture and grew leafy greens. The data was normalized for energy and water utilized over a year divided by the yearly productivity. Data from all three systems was then compared using statistical analysis.

 Results

Areal Productivity

When comparing hydroponics and aquaponics there was no significant difference in the areal productivity. However, there was a significant difference between the ponic-systems and the California-based system. Ponic-systems were found to be 10 to 29 times more productive than the California-based system. In addition, areal productivity in hydroponics could be substantially improved increasing vertical production in closed environments.

Energy Usage

Hydroponics uses 30 times more energy (lighting, cooling) than the California-based system. There was no significant difference in energy usage between aquaponics and California-based system. However there were differences in energy usage between aquaponic growers, therefore it is would be wise to compare each aquaponic grower to the California-based system in the future.

 Water Usage

California-system uses 66 and 8 times more water than hydroponics and aquaponics. There were differences in water usage between hydroponics and aquaponics, however the authors suggests that results maybe skewed due to the lack of data points.

Conclusion

Based on the authors study, it seems that ponic-systems are overall more efficient than California-based system. They believe that these systems should be integrated into urban cities. By integrating such systems, cities become less reliant on vegetable and fruit production from California. At the same time it reduces the negative environmental footprint. Nevertheless, the biggest challenge will be to address the socio-economic challenges in integrating the system into urban environments.

Chlorophyll Fluorescence Biofeedback System

Citation

van Iersel, M. W., Weaver, G., Martin, M. T., Ferrarezi, R. S., Mattos, E., & Haidekker, M.

(2016). A Chlorophyll Fluorescence-based Biofeedback System to Control Photosynthetic Lighting in Controlled Environment Agriculture, Journal of the American Society for Horticultural Science J. Amer. Soc. Hort. Sci.141(2), 169-176. https://doi.org/10.21273/JASHS.141.2.169

Background

Controlled environment agriculture (heavily managed, indoor production facilities that include greenhouses, growing facilities, and indoor farms) has become an increasingly important part of agriculture in the world.  But, it is expensive as electricity and resources in these systems can quickly push up produce price. It makes sense to optimize energy costs to produce the most food (edible biomass) possible. By reducing inefficiency, it might be able to optimize the system to maximize the economics of this industry.

The authors chose to examine chlorophyll fluorescence as a way to address this problem. When light energy encounters a plant, the leaves absorb the light to power the electron transport chain (ETC – a system that produces sugar, the primary food for plants). As this happens, some of the light is reflected or absorbed and does not help power the ETC. One of the byproducts is a fluorescent excitation of molecules that can be measured and accurately predict how well the plant incorporates light into the ETC versus how much light is lost due to efficiency. Research has shown that measuring this can help predict the efficiency of photosystem II, one of the integral parts of the ETC. Written as ɸPSII, this efficiency reduces over the course of a day due to some molecules being degraded and then losing functionality (D1 proteins). Another way to reduce ɸPSII is through non-photochemical quenching (NPQ). NPQ results from too much heat in the leaf that cannot be dissipated. So, the plant makes molecules (called Xanthophylls) to deal with the excess heat and help dissipate it. The authors think that they should measure and target a certain level of ETC efficiency with a certain level of light (photosynthetic photon flux density, or PPFD in µmol m-2 s-1) and attain a specific electron transport rate (ETR) by using a feedback system that automatically adjusts light. If the model works, they believe it can be scaled up to be used in a larger setting and reduce cost.

Materials and Methods

The study revolves around the setup and use of a biofeedback control system that measures ɸPSII and calculates ETR using a chlorophyll fluorometer called a MINI-PAM. This device is clamped onto one portion of the leaf, and the established plants are tested in a growth chamber. The biofeedback system takes fluorescence measurements, calculates ETR, compares it to the target ETR (ETRT), and adjusts the LED duty cycle (on/off rate) to increase or decrease the light available to the plant. This is all done automatically based on short term averages. The MINI-PAM applies a saturating pulse of light and then measures the reflected light to estimate various metrics including fluorescence, ETR, NPQ, and ɸPSII.

The authors selected three plants with varying levels of light requirements: Pothos (low light), Lettuce (intermediate light), and Sweetpotato (high light).

They used two different methods to adjust ETR: 1) Maintain constant ETR for 16 h and 2) Increase ETR from 0 to maximum ETR in 7 steps (for 1 h each), and then back down to 0. The ETRT for each plant species was selected based on preliminary data not shown here.

Results


Maintaining a Stable ETR:


Lettuce was the only plant examined for stable ETR. It was tested at ETRT of 70 and 100 µmol m-2 s-1 (unit is related to amount of light applied to the plant), with 70 being the maximum ETRT determined for the crop. It was found that ɸPSII was initially low (around 0.5, while healthy leaves should be close to 0.7 or 0.8), but that was the case due to the need for reaction centers to open and produce ATP and NADP. These molecules assist portions of the ETC and are produced by the Calvin Cycle, which begins running off of byproducts of photosynthesis. So, as these molecules were replenished by the Calvin Cycle, ɸPSII quickly increased to ~0.7 and ~0.6 for ETRT of 70 and 100 µmol m-2 s-1 respectively. The ETR at 70 µmol m-2 s-1 was much more tightly controlled than at 100 µmol m-2 s-1. This is partially due to the biofeedback control system only needing to adjust the lower ETRT slightly, as the higher ETRT was more unstable. The increased variation in the higher ETRT was a result of increased NPQ that reduced ɸPSII and caused a PPFD increase over time (20 µmol m-2 s-1). So, the higher ETRT caused instability over the course of the day that increased NPQ, reduced ɸPSII, and caused a need for increased PPFD that increased cost.

Stepwise ETR

This stepwise experiment was conducted using all three plants (lettuce, pothos, and sweetpotato). The maximum ETR was achieved by seven equal increases in ETRT from 0, and seven equal decreases in ETRT back to 0. Each step lasted 1 h. During the initial steps up, the ETR was more tightly controlled by the PPFD. Little variation occurred when compared to the decreasing steps (which also required a higher PPFD, due to the decrease in ɸPSII that occurs over the course of the day). There was a decrease in ɸPSII as ETRand PPFD increased. In all three species, this decrease was associated with an increase in NPQ, which is typical. In lettuce and pothos, NPQ increased throughout the trial, but also decreased as ETRT decreased. In sweetpotato, it increased differently, meaning that the xanthophyll production is variable between species. Due to the differing relationship between NPQ and ɸPSII, it indicated that the period of decreasing ETRT was caused by photoinhibition and not NPQ, or else several measures of chlorophyll fluorescence would have responded differently. This was confirmed as ɸPSII was restored after a period of darkness that allowed the D1 protein to be re-synthesized.

Conclusion

Chlorophyll fluorescence is a tool that can be used to assess the efficiency of lighting and plant environmental conditions in order to optimize a system. Based on the physiological metrics of the plant, the lighting conditions can be controlled in greenhouses, vertical farms, and other production systems in order to increase efficiency and limit wasted energy and cost. More biofeedback systems can be designed an implemented in order to create an ideal growing condition.

Physiological and Morphological Changes Over the Past 50 Years in Yield Components in Tomato

Physiological and Morphological Changes Over the Past 50 Years in Yield Components in Tomato

Tadahisa Higashide and Ep Heuvelink

Horticultural Supply Chains Group, Wageningen University, Marijkeweg 22, 6709 PG Wageningen, The Netherlands

Citation

Higashide, T., & Heuvelink, E. (2009).Physiological and Morphological Changes Over the Past 50 Years in Yield Components in Tomato . Journal of the American Society for Horticultural Science134(4), 460-465.

Background

Greenhouse tomato yield in The Netherlands has more than doubled since the 1980s. This increase is caused by environmental effects such as greenhouse and controlled environment production practices and improved cultivation techniques. In addition to production environment improvements there are genetic effects that positively influence performance that are attributable to breeding efforts.

The aim of this research was to investigate whether  tomato cultivars that were released between 1950 and 2000 show an increasing trend in the trait “yield” which is an aggregate of many traits that are influenced by plant morphology and plant physiology.

Experimental Design

Eight Dutch tomato cultivars [Moneymaker (release in 1950), Premier (1960), Extase (1960), Sonatine (1975), Calypso (1982), Liberto (1988), Gourmet (1991), and Encore (2002)] and one Japanese cultivar [Momotaro Fight (2001)] were tested in a randomized complete block design with each cultivar (genetic treatment) occuring in each block randomly. Two blocks were tested under the same environmental conditions to account for spatial variation. All cultivars were indeterminate type and had medium–large round fruit. Plants were measured destructively and non-destructively for various morphological and physiological traits that are considered to be components of yield.

Results

An increase in tomato yield because of breeding efforts was not caused by an improvement in resource partitioning to the fruit but by an improvement in resource partitioning to vegetative characteristics that resulted in higher dry matter. This increase in vegetative dry matter production was caused by higher light use efficiency and is influenced by tomato morphology and architecture. This result is consistent with previous studies in maize (Hay, 1995).

The leaf photosynthetic rate of the modern cultivars increased proportionally to light use efficiency indicating that there is a positive relationship between light use efficiency and leaf photosynthetic rate. Light use efficiency and leaf photosynthetic physiological traits were indirectly selected for over the course of 50 years as a product of selecting and releasing cultivars that had the highest yield. Yield an aggregate trait of many physiological and morphological characteristics. A more detailed study of leaf photosynthetic rate would need to be done to clarify the cause of its increase over the 50 years of variety release.

Yield of the Japanese cultivar was significantly lower than the other Dutch cultivars. This is likely because breeding objectives of Japanese cultivars are geared more toward quality instead of yield. Soluble solids in the Japanese cultivar was significantly higher than the dutch cultivars.

We can use this knowledge to inform future breeding efforts

Yield as we measure it is an aggregate of many components (Figure 2). From the results of this study we know that all components of yield do not contribute to yield improvement equally. We can optimize future breeding efforts to improve morphological and physiological characteristics that directly improve performance of a variety measured as yield. Focusing on yield components that are directly proportional to variety performance measured as yield could  improve our ability to map regions of the genome that are associated with specific morphological and physiological traits to determine the genetic basis of yield. To better implement morphological and physiological traits resulting in measurable yield increase into a breeding program seed companies would need to develop  high throughput phenotyping techniques as many of these measurements are not cost effective in larger population sizes.

Literature cited

Hay, R.K.M. 1995. Harvest index: A review of its use in plant breeding and crop physiology. Ann. Appl. Biol. 126:197–216.

LEDs for photons, physiology and food

Original paper: P. M. Pattison, J. Y. Tsao , G. C. Brainard, and B. Bugbee 2018. LEDs for photons, physiology and food. Nature. 563:493-500. https://doi.org/10.1038/s41586-018-0706-x

Compared to traditional lighting, LED lighting offers greater light control, improved performance, and decreased energy consumption. Due to these facts, LED lighting is beginning to be used for an array of new applications to improve human health and localize food production in controlled environments. For the first time in history, the use of LED lighting enables humans to engineer lighting of environments to elicit specific responses.

Four main features separate LED lighting from traditional lighting – light spectral control, light intensity control, control of light distribution in space, and ready integration with other technologies. LEDs for photons, physiology, and food outlines some of the applications and research avenues that LED lighting will enable in both humans and plants.

Lighting impacts both humans and plants greatly. In humans, light affects daily rhythms of sleep and wakefulness, body temperature, alertness, psychomotor performance, neurocognitive responses, and the secretion of hormones. Among the open questions posed regarding lighting for human health and productivity are the nature of the detailed pathways within the melanopsin-based photoreceptor system, interactions between the retinohypothalamic and primary optical tracts, the relationship between the dose of light and physiological regulation in everyday environments, and how to frame our understanding of the positive and negative effects of light. Light-emitting diodes will enable more precise and effective lighting research to be conducted relating to the aforementioned questions, which will enable LED lighting to be increasingly tailored to enhance human health and productivity.

Plants not only require light as fuel for photosynthesis but also use light as a signal to direct plant morphology and metabolite profile. Light sources and color filters have long been used to investigate plant responses to light. However, prior to LED lighting, many of these studies have been limited, mainly because they were conducted at low light levels on single leaves. LED lighting now enables research to be conducted at higher light intensities at the plant canopy level. Additionally, LED lighting allows light intensity, spectrum, and timing of light application to be precisely controlled, taking plant-light response research to new levels.

LED lighting has not only enhanced our understanding of plant-light responses but has also made it cost-effective to grow certain plants indoors for food. To demonstrate the efficacy of indoor agriculture, the authors calculate the grams of dry mass produced per mole of photons for various crops. In doing so, the authors conclude that the photon cost (% of dry market price) is 1% for microgreens, 5% for lettuce, 18% for tomatoes, 103% for general vegetables (i.e. broccoli), and 10,000% for staple crops (i.e. rice).

The main parameters driving the increased photon cost for the above mention crops are:

  1. Fraction of photons absorbed by the plant: Microgreens can be grown at a very high density, thus the fraction of photons absorbed by the plant is very high. However, as plant size increases, plant spacing must also increase. Increased spacing between plants leads to reduced radiation captured and thus reduces the fraction of photons absorbed by plants, as some of these photons will inevitability be lost in space between plants.
  1. Quantum yield (moles of carbon fixed per mole of photons absorbed): The more a particular crop benefits from increased light levels will dictate its quantum yield. Lettuce benefits from higher light levels than microgreens and tomato benefits from higher light than lettuce, thus the quantum efficiency of lettuce is lower than that of microgreens and the that of tomato is lower than lettuce.
  1. Harvest index (moles of carbon in edible product per mole of carbon in plant biomass): Microgreens and lettuce have a very high harvest index as the entire aboveground portion of the plants are edible. Alternatively, tomato stems and leaves are not edible, reducing harvest index. Other general vegetables and staple crops harvest index is further reduced, as these crops generally posses even less edible plant biomass. Thus, for crops with low harvest index, photons are being captured by non-edible plant biomass, leading to increased photon cost per dry mass.

Based on these parameters the authors concluded that “electric light input is a small cost for microgreens, a high cost for general vegetables, and an unacceptable cost for staple crops”. Currently, most indoor farms are focused on growing leafy greens. However, as LED lighting efficiency and technology continues to increase, more general vegetables will be attempted to be grown indoors. Nevertheless, according to this report, even if LEDs were 100% efficient, growing staple crops indoors would not be cost-effective.

It is clear that LED lighting will continually replace traditional lighting and become the standard light source for humans and plants. By 2035, it is estimated that 86% of electrical lighting installs in the U.S. will be LED, which will save roughly US$52 billion per year in direct energy costs. Research into physiological responses to light will allow lighting systems to be optimized and the full potential of LED lighting to be reached, which include improving human health and productivity, increasing the feasibility of local food production in controlled environments, and decreased energy consumption.

Hydroponics vs. Soil Cultivation: Functional and Taste Compound Comparison

Original Paper
Tamura Y, Mori T, Nakabayashi R, Kobayashi M, Saito K, Okazaki S, Wang N and Kusano M (2018) Metabolomic Evaluation of the Quality of Leaf Lettuce Grown in Practical Plant Factory to Capture Metabolite Signature. Front. Plant Sci.9:665.
doi: 10.3389/fpls.2018.00665

Context

Cultivation of certain crops is moving out of the field. Indoor production has taken the form of greenhouses, tunnels, and plant factories. These growing methods been collectively deemed controlled environment agriculture (CEA). The attraction is in the name – control. Moving crops out of the field helps remove risk of unpredictable weather and can allow for optimized conditions for crop production. It even enables year-round growing that provides a steady source of fresh food to the public and income to the growers instead of the seasonal flux of traditional agriculture.

With food moving indoors under controlled conditions, crops are receiving different types of input in terms of nutrients, lighting, day/night cycling, temperatures, disease and pest stresses, and other variables. Some crops are growing differently and looking different as well. It all depends on the control conditions.

As plant growth and development changes due to these controlled environments, the metabolic processes dictating that growth and development are probably varying as well. As a result, there may be changes in the plant’s profile of chemical compounds, or metabolites, which take part in and are produced by plant metabolism. These compounds are integral to the structure and general function of the plant as well as its defense against pests and disease. Again, with cultivation conditions changing, the metabolite compositions of the plants are likely changing simultaneously.

The Experiment

If we want to know if or how CEA is changing the metabolite profiles of our food compared to field cultivation, we need to isolate each element of the “control” to determine what changes are being caused by which conditions. To this end, a group from RIKEN in Japan that studies metabolite profiles (an analytical chemistry practice called metabolomics) chose to compare compounds of lettuce grown in a hydroponic system (plant roots growing directly into water with an added nutrient solution) within a Keystone Technology Inc. (Japan) plant factory to lettuce grown in a similarly-controlled growth chamber except planted traditionally in soil (Table 1).

Table 1. Plant factory conditions for hydroponic cultivation treatment compared to growth chamber conditions for the soil treatment.

This group chose two lettuce cultivars, ‘Black Rose’ and ‘Red Fire’, with one head of each cultivar grown per treatment – hydroponics and soil – for a total of 4 heads of lettuce in the experiment. Tamura et al. observed smaller and more pigmented leaves from the soil-grown lettuce compared to the hydroponic production. To detect the metabolites present in the lettuce they used precise instruments (gas and liquid chromatography mass spectrometry). They included samples from leaves on the outside of the head and the middle to account for variation in metabolite production in different parts of the plant.

Findings

Analysis resulted in 133 identified compounds and 185 unidentified. Based on the relative abundances of all 318 metabolites, they were able to clearly separate samples of hydroponically grown lettuce from those grown in soil.

Upon further study, they determined that hydroponic lettuce had higher amounts of amino acids (protein building blocks) than the soil-cultivated lettuce. On the other hand, lettuce grown in soil contained more sugars and compounds that contribute to taste and possible health-benefits, such as sesquiterpenes and organic acids. Particularly, glutamate, a metabolite contributing to the umami (or savory) taste profile of a food, was significantly higher in ‘Red Fire’ lettuce grown hydroponically. However, a sugar, sucrose, and a compound associated with bitterness, lactucopicrin-15-oxalate, were both significantly lower in the hydroponic lettuce.

Conclusions and Considerations

This study is valuable due to it being the first of its kind—applying metabolomics to understand how our crops are changing in CEA systems. These results need to be validated by another experiment in which the conditions other than soil/hydroponics are identical. Previous work by Li and Kubota (2009) demonstrated that differences in light intensity and quality can affect metabolite production in a CEA setting.

Additionally, different fertilization regimes largely influence the amount of nitrogen plants can access to produce amino acids. With the hydroponic lettuce receiving almost 3x the fertilizer compared to the lettuce in soil, a higher amino acid content in hydroponic lettuce cannot be completely attributed to hydroponic production itself. Therefore, the differences in control conditions presented in Table 1 above are confounded with the soil/hydroponic treatments, making interpretation of results complicated. This also points to the importance of collaboration across scientific disciplines to ensure the most effective and efficient experiments are conducted.

Citations

Li, Q., and Kubota, C. (2009). Effects of supplemental light quality on growth and phytochemicals of baby leaf lettuce. Environ. Exp. Bot. 67, 59–64. doi: 10.1016/j.envexpbot.2009.06.011

Design for an Improved Temperature Integration Concept in Greenhouse Cultivation

Original paper: O. Ko¨rner *, H. Challa Design for an improved temperature integration concept in greenhouse cultivation Farm Technology Group, Department of Agrotechnology and Food Sciences, Wageningen University, Mansholtlaan 10, 6708 PA Wageningen, The Netherlands Received 22 July 2002; received in revised form 15 November 2002; accepted 28 December 2002. https://doi.org/10.1016/S0168-1699(03)00006-1

     Heating energy represents more than two-thirds of a typical greenhouse total energy consumption. Is currently well known that the average day and night temperatures are what controls how fast plants develop. As the temperature increases, crops develop much faster, but there is a significant cost associated, which typically leads to an increase in energy consumption. To mitigate the cost and become more efficient in the control environment production, an approach to improve temperature integration concept could play an essential role in energy savings. Temperature Integration Concept is based on the ability of crops to tolerate temperature deviation from their biological set points. The integration concept manipulates temperature, aiming to be compensated within a pre-set period without having adverse effects on plant growth.

     Theoretically, a crop with more dynamic and flexible temperature boundaries could potentially play an important role, so this study aimed to improve the temperature integration concept by introducing dynamic temperature constraints. A modified temperature integration procedure was designed combining the usual long-term temperature average over several days and fixed boundaries for daily average temperature with short-term temperature averages over 24 hours with a very flexible temperature limit. The overall idea is based on a concept called the Freedom for temperature fluctuations. This concept allows the temperature to freely fluctuate due to the environment without being controlled by heating or ventilation. Temperature fluctuation increases with longer averaging period and increasing temperature bandwidth, which allows longer periods of several days, which enables compensation of warm or cold periods resulting in higher energy savings.

     The proposed regimen for temperature integration was performed by modeling and simulation techniques (MATLAB version 6.0) using tomato as a model crop. Variables such as air temperature, outside radiation, relative humidity, and CO2 measurements were input in the model with a fixed time of 5 min over one year. Measurements such as setpoints for heating, ventilation and CO2 concentrations were calculated with a climate control model (CCM) which provide enough information for calculating relative humidity, air temperature, energy consumption, and natural gas consumption. For accuracy, energy loses where also consider into the model. Two reference temperature regimens were used for comparison:  BP= commercial standards, setpoint increase linearly, and a Bpfix= night and daytime heating and ventilation temperature setpoints were fixed (uncommon practice). The heating setpoints were 18, and 19 °C and ventilation set points were 19 and 20 °C for night and day, respectively. The weather prediction was also used for providing data into the model simulation. Validations of the CCM model was performed in four semi-commercial Venlo-type greenhouse compartments.

     Two temperature integration regimens were model by the Autor: RTI (regular temperature integration) and MTI (modified temperature integration) both with a bandwidth of +/- 2, +/- 4 and +/- 6. The modified regime model (MTI) resulted in more energy saved when compared with regular temperature integration model (RTI) and the BP controls. Energy-saving increased with temperature bandwidth in all cases evaluated. Fluctuation during a cold time (winter) was observed. Overall, yearly greenhouse energy saving increased by up to 23% compared with the BP regime (temperature with a bandwidth of +/- 6 C). Compared with regular temperature integration energy-saving increased relatively with 14%. Interestingly, the setpoint for relative humidity profoundly influenced energy-saving suggesting further focus in future evaluations. When evaluating the different temperature dose-response data, they observe than an increase in the duration of maximum and minimum temperature increase energy saving and gross photosynthesis of tomato plants, which can be traduced to more photosynthetic efficiency. In conclusion, the conceptual design for advance temperature integration control seems to be promising for energy reduction. The distinction between short- and long-term processes in temperature integration lead to an increase in energy savings. A more advanced flexible humidity control concept could probably help to decrease energy consumption further since the highest energy saving was achieved when no humidity control was used.

Maximizing crop photosynthesis across the entire canopy requires the optimization of many environmental factors

Original paper: Körner, O., Heuvelink, E., and Niu, Q. 2009. Quantification of temperature, CO2, and light effects on crop photosynthesis as a basis for model-based greenhouse climate control. The Journal of Horticultural Science and Biotechnology. 84:233-239. https://doi.org/10.1080/14620316.2009.11512510


Photosynthesis is impacted by multiple environmental factors including temperature, light intensity, and carbon dioxide (CO2) concentration. If optimal environmental conditions that maximize photosynthesis are quantified, they can be employed in controlled environments to increase crop productivity. Attempts to measure such optimal conditions have been undertaken in the past. Environmental setpoint measurements from these studies have even been compiled and implemented into various mathematical models known as “crop photosynthesis models” (CPMs) that can predict potential photosynthetic activity based on a plant’s environment. However, many of the environmental setpoints used in CPMs have relied on leaf-level photosynthesis measurements and optimization which are not always compatible with canopy-wide photosynthesis optimization. This potential incompatibility is caused by differences in the microclimate between the various levels in a crop’s canopy. For example, light intensity generally decreases as you move from the top of the canopy down to lower leaves. Also, there can be large variations in individual leaf temperature and humidity throughout the canopy which will affect photosynthesis. Other studies have investigated canopy-wide photosynthesis, but many were performed in poorly-sealed greenhouses where conditions could potentially fluctuate. Oliver Körner and his colleagues sought to more accurately quantify optimal environmental conditions for canopy-wide photosynthesis by using well-sealed greenhouses equipped with air conditioning and CO2 supplementation. These environmental control measures allowed for experiments in which temperature and CO2 concentration could be effectively manipulated and accurately maintained. The ability to control CO2 concentration and measure CO2 consumption in the greenhouse system was critical to this study. Photosynthesis was quantified by monitoring the amount of CO2 consumed by the plants in the greenhouse. Minimizing any gas exchange with the natural environment was crucial to ensure any measured CO2 change was a result of photosynthesis.

The photosynthetic responses of two different crops (cut-chrysanthemum and tomato) were quantified under different temperatures and CO2 concentrations. ‘Reagan Improved’ chrysanthemum plants were exposed to different combinations of three temperature setpoints (23, 28, and 33 °C) and three CO2 concentrations (400, 700, and 1000 µmol CO2 mol-1) under natural light levels. Similarly, CO2 consumption was measured in ‘Moneymaker’ tomatoes under different combinations of three temperature setpoints (20, 26, and 32 °C) and two CO2 concentrations (400 and 1000 µmol CO2 mol-1). Increasing CO2 concentration raised the maximum potential photosynthetic rate in both crops across all tested temperature setpoints, and this effect was greater in chrysanthemum than tomato. Additionally, higher CO2 levels led to a higher photochemical efficiency (µmol CO2 µmol photons-1) in both chrysanthemum and tomato. Temperature effect on photosynthetic rate was more complicated although photochemical efficiency in both crops consistently decreased as temperature increased. In chrysanthemum and tomato, both light intensity and CO2 concentration affected how temperature affected maximum photosynthetic rate. Using discrete light intensities (600, 900, and 1200 µmol m-2 s-1), optimum temperatures for maximum photosynthesis at 400 and 1000 µmol CO2 mol-1 were calculated. In chrysanthemum, the optimum temperature at all three light intensities was below 23 °C at 400 µmol CO2 mol-1 so a trend was not clear. At the same CO2 concentration in tomatoes, optimum temperature for tomato photosynthesis increased with higher light levels, and the largest increase in optimum temperature occurred between 900 and 1200 µmol m-2 s-1 (25.3 to 27.1 °C). Optimum temperature for chrysanthemum and tomato photosynthesis at 1000 µmol CO2 mol-1 both increased when light intensities increased. At this CO2 concentration, optimum temperature changed the most in both crops when light intensity was changed from 600 to 900 µmol m-2 s-1. Specifically, chrysanthemum optimum temperature changed from 23.5 °C to 26.9 °C while tomato optimum temperature increased from 26.6 °C 28.4 °C.

Körner and his colleagues sought to quantify the optimum environmental conditions (temperature, CO2 concentration, and light intensity) for canopy-level photosynthesis in two crops (cut-chrysanthemum and tomato). Higher CO2 levels increased maximum photosynthesis and photochemical efficiency in both crops with this effect being greater at higher temperatures. Similarly, higher CO2 concentration led to an increased optimum temperature for photosynthesis, and this occurred at the largest level when light intensity was high. Variability in the canopy microclimate (most notably temperature and light intensity) resulted in different environmental factor effects than those observed in leaf-level photosynthesis models. In general, environmental conditions caused smaller changes in canopy-level photosynthesis when compared to leaf-level photosynthesis. While basic trends were similar in both chrysanthemum and tomato, the results indicate that optimum environmental conditions for photosynthesis must be quantified for individual crops. Differences between crops including leaf area and canopy architecture must be accounted for to create accurate CPMs. In conclusion, this study indicates that crop-specific responses to interactions between multiple environmental factors must be accounted for in CPMs to accurately quantify canopy-level photosynthesis.