

Blog
Exploring valuation of ecosystem services with i-Tree

When we first created ARTrees, a primary intention was to increase public understanding of trees by reimagining and reexplaining scientific data, literature, and policy. One important bit of science we are particularly interested in dissecting is the valuation of ecosystem services. This concept can be understood as the estimation of services provided by nature in a unit understood by humans: money.
Converting the work of nature into a human currency is a complicated process, so there are a number of methods that have been developed to encompass the wide variety of approaches. One approach has been built into a toolkit called i-Tree. i-Tree includes a suite of tools for measuring various aspects of forest systems, and was developed by the US Forest Service. Of the iTree tools, i-Tree Eco aims to assess the ecosystem services of urban forests, including net storage of carbon, effects of trees on heating and cooling nearby buildings, and removal of urban air pollutants, to name a few.
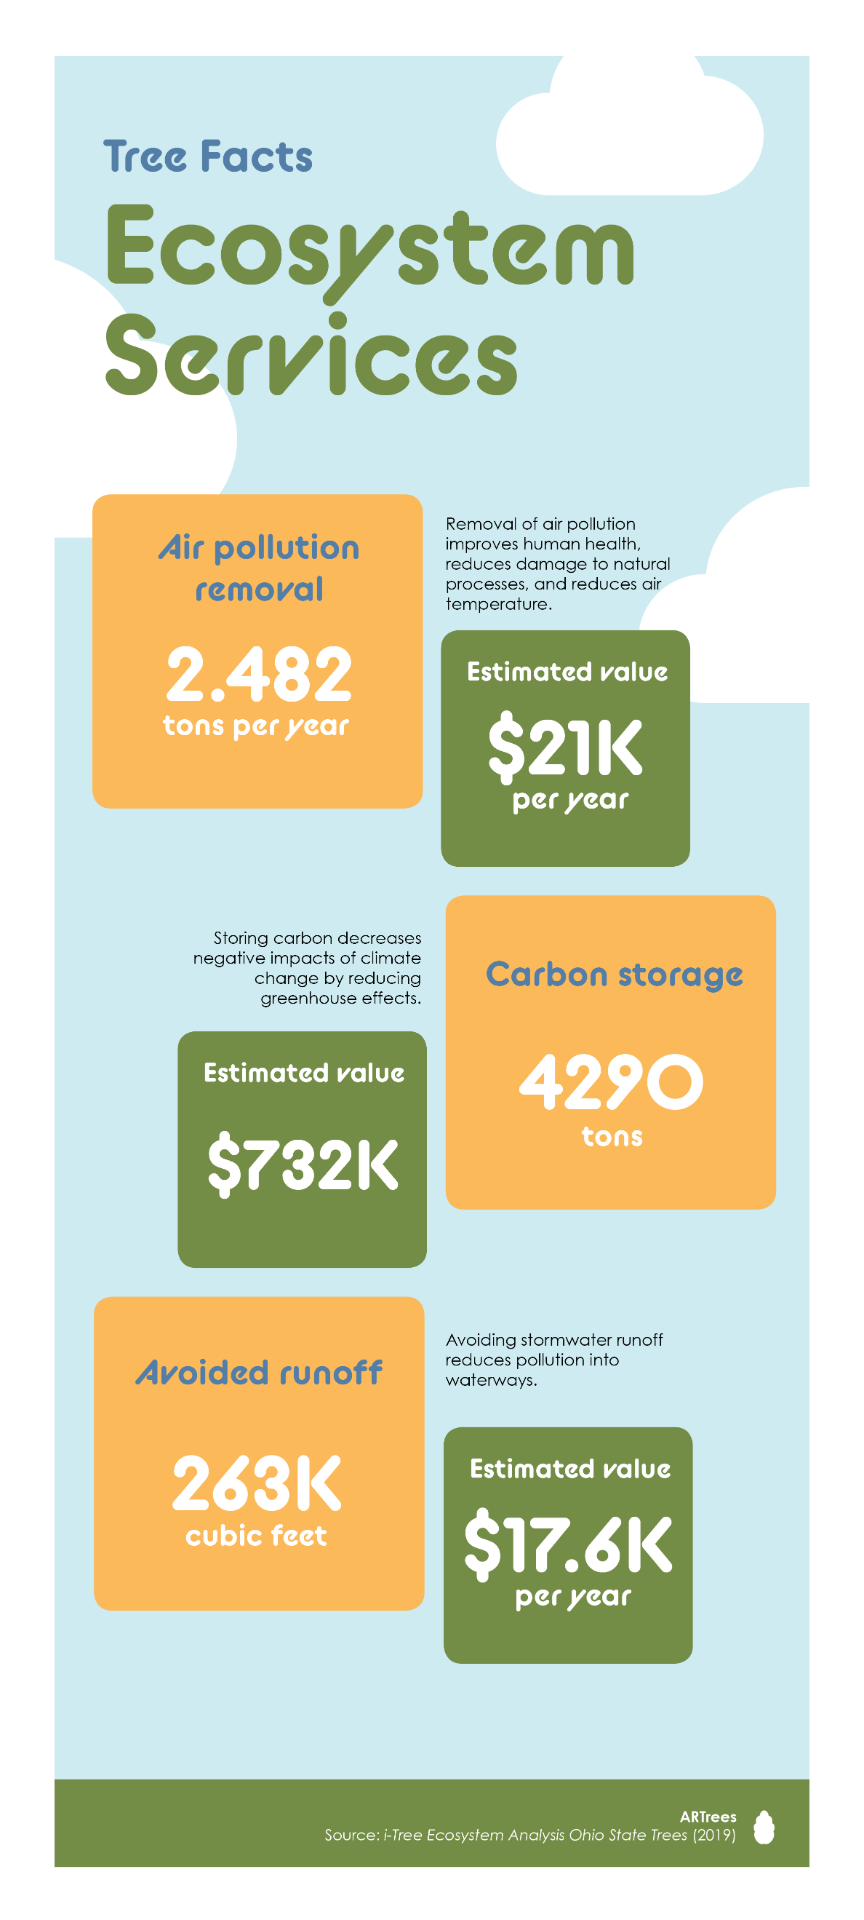
In 2019, OSU conducted an analysis of campus trees using this tool. Select findings from the report are visualized in ARTrees within the field journal feature, which connects $ values of key services to corresponding trees as users walk throughout campus. The ecosystem services we chose to highlight are structural value, carbon storage, and pollution removal.
Structural value can also be understood as replacement value, because it represents the cost required to replace a tree with one of similar value. Inputs to attain structural values include the type of tree, its diameter and condition, and placement of the tree. These values can be viewed on a forest level or an individual level. In the app, values represent individual-level data. On a forest-level, trends in structural value correspond to the health of the forest. Healthier trees mean greater productivity and higher structural values. In this way, structural value can be viewed as an indicator of forest health.
Carbon storage refers to the net amount of carbon stored in a tree’s branches, trunk, and roots. It is calculated by estimating total biomass of a tree, and adjusting for conditions in which the tree is growing. (E.g. urban trees that are maintained often tend to have lower biomass than trees growing in wild conditions)
One way to understand physical carbon storage quantities is by comparison to major sources of emissions. In comparison to automobile emissions, the amount of carbon stored by OSU trees is equivalent to the annual emissions of 3,040 cars. Annual emissions of a single car were calculated using national averages of vehicle emission rates multiplied by average miles driven per vehicle in 2011, per data by the US EPA and Federal Highway Administration.
In comparison to household emissions, carbon storage by OSU trees was equivalent to the annual emissions of 1,240 single-family homes. Annual emissions of a single household were based on national averages of electricity, natural gas, fuel oil, kerosene, LPG, and wood usages per household in 2009, per data by the Energy Information Administration.
Pollution removal is the ability of trees to cycle air and remove airborne pollutants (such as ozone, sulfur dioxide, and particulate matter 2.5) while doing so. Rates of air pollution removal varies by factors such as leaf area, leaf phenology, and local weather events, all of which must be factored into the model. Interestingly, pollution removal sometimes comes with unexpected effects, including rare cases that generate worse air conditions. For example, it is possible for net removal of PM2.5 to be negative, or for trees to resuspend more particles than they remove, increasing concentrations of pollution. This can occur in droughty conditions, but is rare. Understanding the ways that pollution removal affects the environment is a crucial part of designing a model which reflects the real world as much as possible. Once quantities of removed air pollution are calculated, these values are factored by avoidance costs, or the value of avoiding adverse health effects from polluted air.
The findings explained above represent only a small portion of the conversation surrounding ecosystem services. Researchers are continuously exploring new ways to value these services, and are also often discovering new relationships we engage in as actors within a deeply interconnected system. The results from this field of research have major implications for how we chose to behave in the future. We hope that ARTrees can provide a greater understanding of ecosystem services, and serve as an invitation to further explore.
View the full i-Tree report on OSU trees below:
A tree story from Chadwick Arboretum’s Horticulturist
 Our most recent tree story comes from Chadwick Arboretum’s horticulturist, Pam Poeth. Read about Pam’s favorite tree on campus, the striped maple, below:
I attended OSU from 1980-1985 and received my Bachelors degree in Ornamental Horticulture. I had not been back to OSU for 30 years until I was hired to work in a position as a horticulturist for the arboretum in 2019. After walking around the arboretum for the first time in 30 years, I recognized in the arboretum one of my favorite trees. I was pleasantly surprised by how well it was doing and it took me back to a time where I was standing with my classmates in front of this tree during the regular plant ID walks in my class with Dr. Stephen Still in 1984.
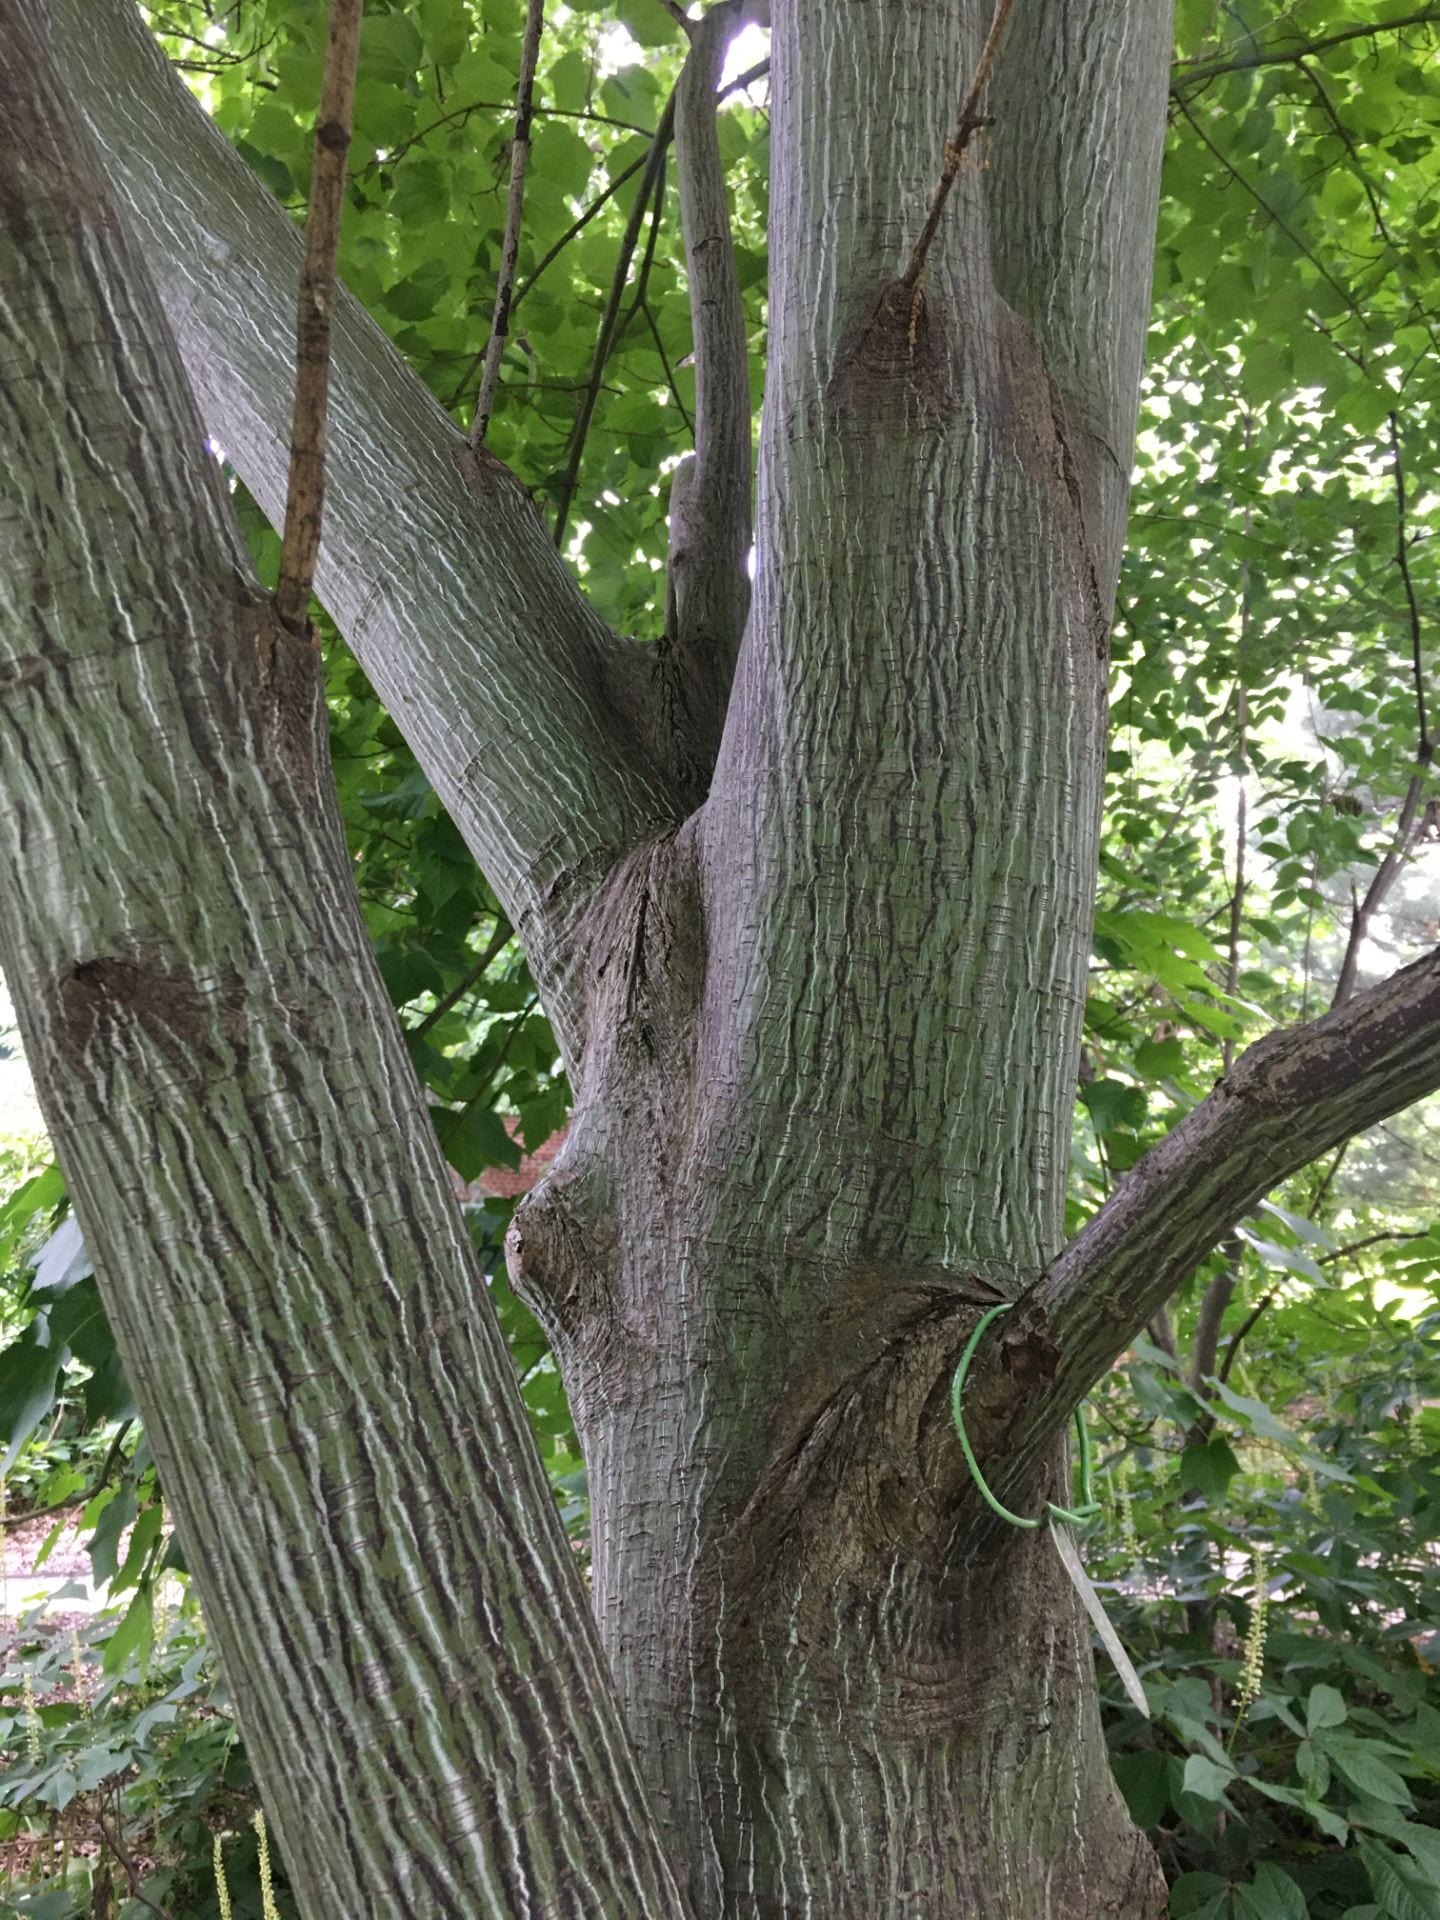
It is located in the Lane Ave. site northwest of the Ag Admin building. This tree is a Striped Maple (Acer pennsylvanicum). At the time, I learned that it was a beautiful understory tree with green and white stripes on the trunk and was not utilized very much or grown in commercial nurseries. This was the case because of its slow growth and difficulty in propagating from seed. It is native to North America.
At this time, the tree was a tiny whip about an inch in caliper and about 5’ in height and now it is about 20’ and 5-6” caliper. I found out that it is currently listed as an endangered species and is still not well known as a tree or produced in commercial nurseries. It does prefer an acid soil but seems to be doing well in our arboretum site in which soils tend to be alkaline. This makes me wonder if it could do well in our area despite the challenges with soil pH. Here is some information on this tree; https://en.wikipedia.org/wiki/Acer_pensylvanicum.
If you are interested in visiting the striped maple mentioned above, explore Chadwick Arboretum’s Lane Avenue Gardens north of the Agricultural Administration building.
Collecting campus tree stories
Trees have stories too. The ARTrees team is collecting these to include as part of the information shared in the app we are developing. Do you have a story you can share with us? Please contact me: youngs.6@osu.edu.
A great example story we have collected is this one from Christopher D. Cook, who was present in 2016 when the historic, Constitution Tree was removed. He wrote about it on his blog:
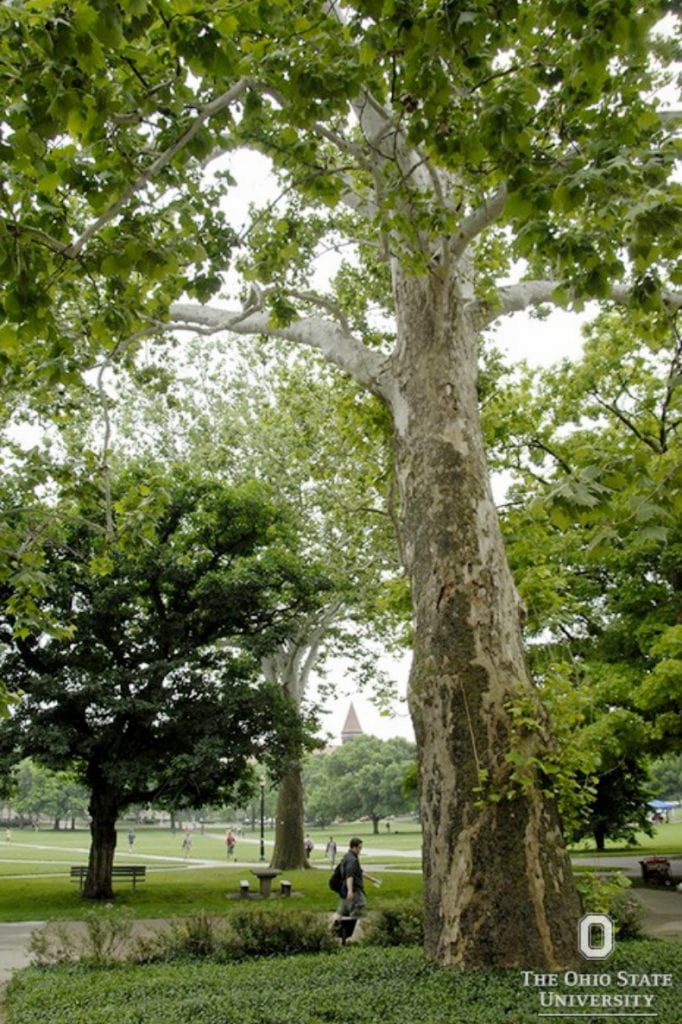
“Having stood for more than a quarter of a millennium, this sycamore was a true witness tree. It was surely home to countless generations of squirrels, birds, and insects through its long life and well loved by humans, too. When Native Americans walked the banks of the Olentangy River (Keenhongsheconsepung as they called it), gathering flint, the tree must have been just another sycamore among an expansive forest of hardwoods. The tree stood silently as hundreds of slaves slipped by its outstretched branches following a nearby Underground Railroad path to freedom. Its bright green leaves might have felt the heat from the flames that consumed the nineteenth-century Armory building, a few hundred feet to the east, on a June day in 1958. Ohio State’s Constitution Tree lived with the students of every class since the first graduated in 1878.” ...read more on Christopher D. Cook’s blog
Chadwick Arboretum Open House
We will be presenting our recent progress on the ap at this year’s Chadwick Arboretum Open House. All are welcome to attend, it is this Sunday, July 21, 2019 at the lake on campus, called Chadwick Lake. Meet trees, insects, and flowers, while eating ice cream! Learn more about our partner Chadwick Arboretum & Learning Gardens here.


Exploring fossil trees
An upcoming feature we plan to include in our app is a section highlighting cultural and historical stories. One in particular we were excited to learn about is Lepidodendron, or “scale trees”, which existed in present day central Ohio during the Carboniferous period 360 million years ago.

This fossil tree will appear as a hidden easter egg, which users would be able to discover while exploring campus. It will be accompanied by a visualization of what a section of the tree is believed to have looked like based off fossil records, as well as an estimation on the present net value of ecosystem service values. Cumulative ecosystem service values are included for this particular tree because we thought it shares important insight on the years of living matter that existed in order make the coal we use today. It was also interesting to compare this number to current market prices, and consider what it means for there to be such a stark difference in values.
A last reason we chose to include this specific fossil plant is because of Ohio’s unique relationship with coal– according to the US Energy Information Administration, coal currently fuels a whopping 58% of net electricity generation in Ohio, showcasing just how much we rely on fossil plants such as Lepidodendon.
Innovate Conference
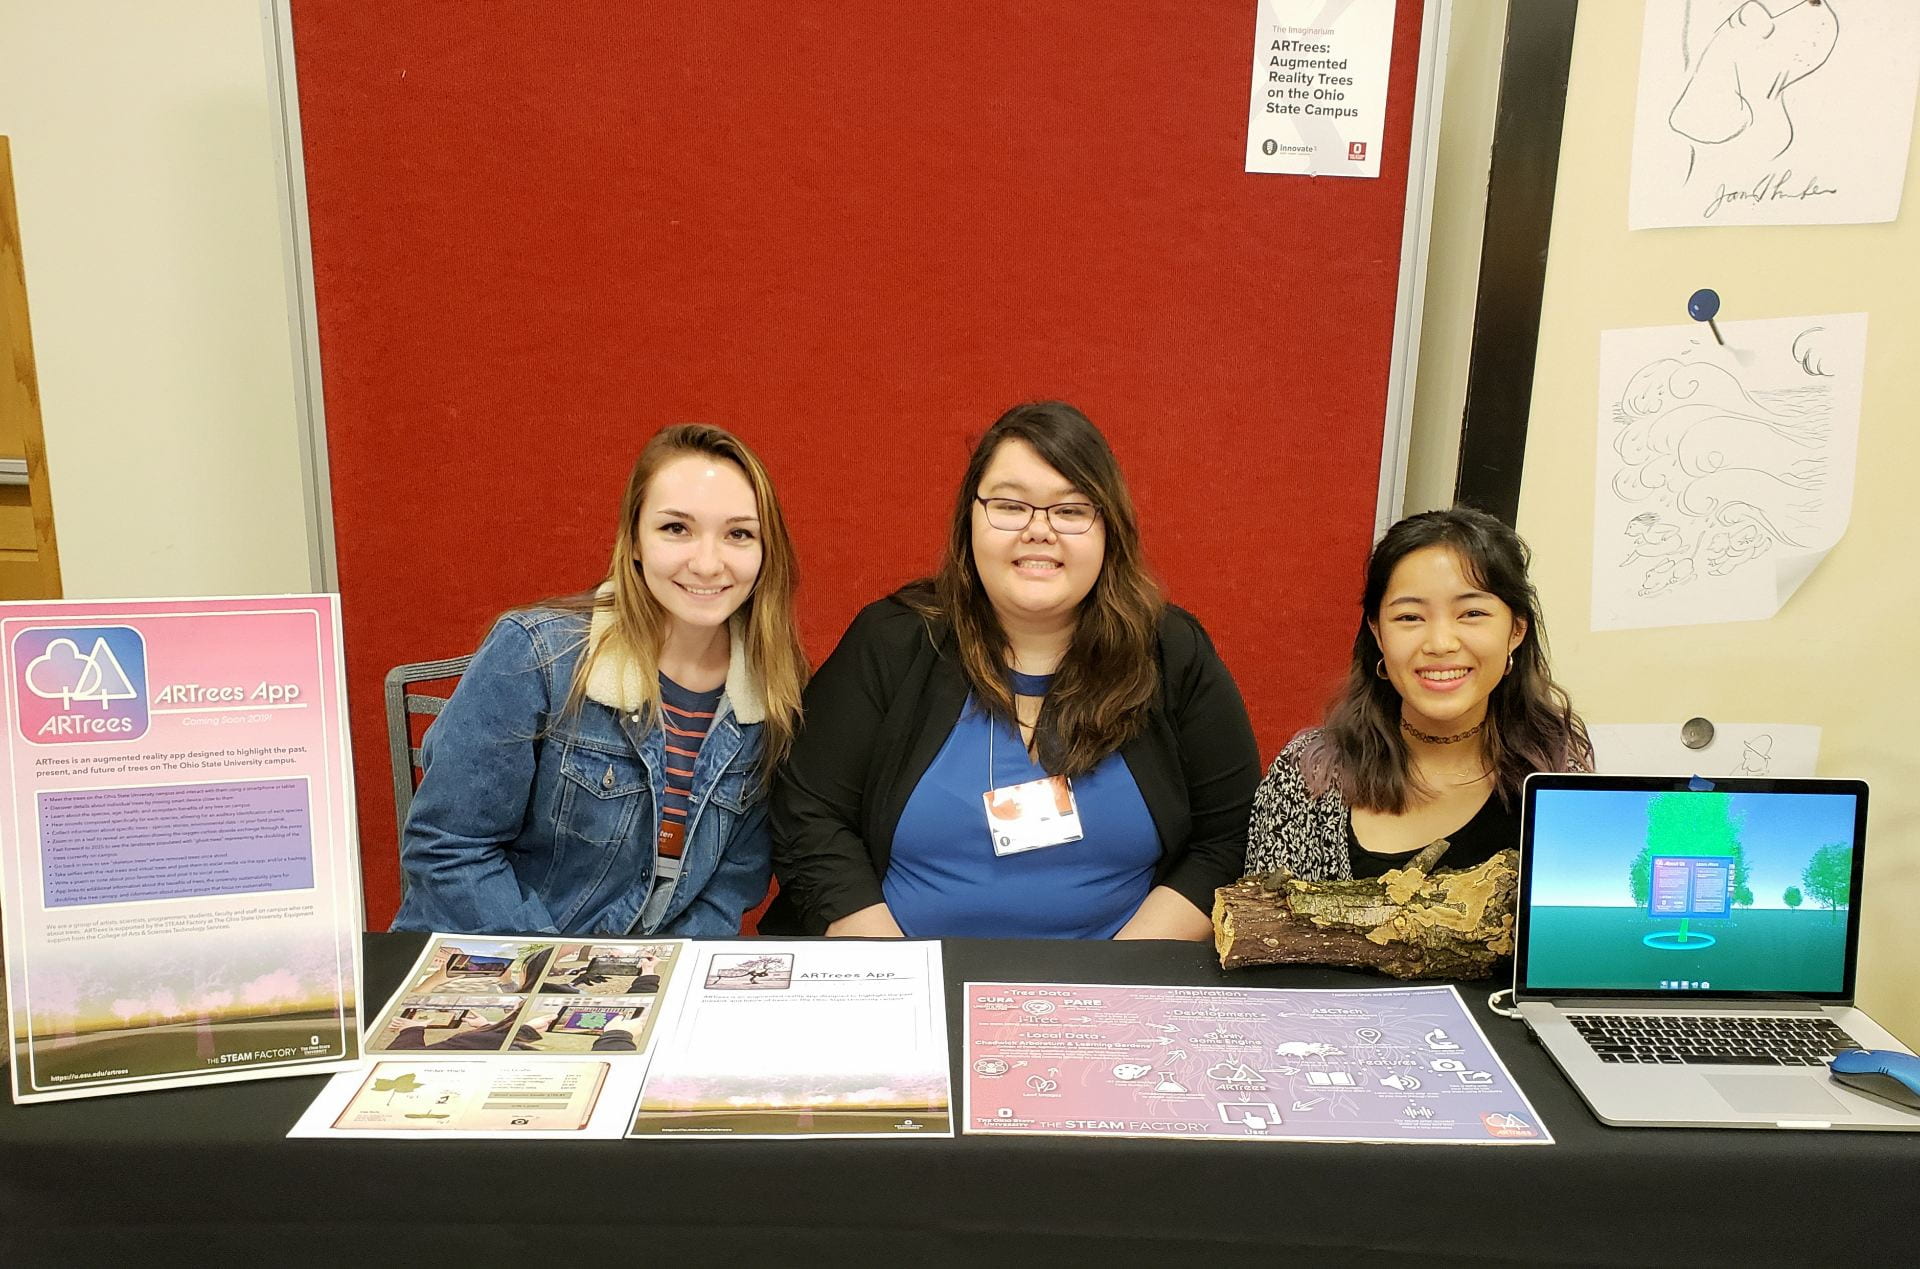

On May 16th, 2019 a few of our team members and faculty had the pleasure of attending the Innovate Conference held in the Ohio Union as guest speakers. This conference is a yearly gathering that brings together educators, administrators and tech industry professionals, and students. Together they explore recent tech advancements, best practices, and interesting approaches to teaching and learning with technology. During the day our team went between sitting at our booth and networking with others attending. We were able to present our app progress during our talk as well as answer questions and gather feedback about our project thus far. It was a great and fun opportunity for all of us!
Updates, Graphics, and Visualizations!
We have been busy updating the user interface with a new clean and sleek palette.


We have also added the microscope animation as well as instructions for the app. More coming soon!
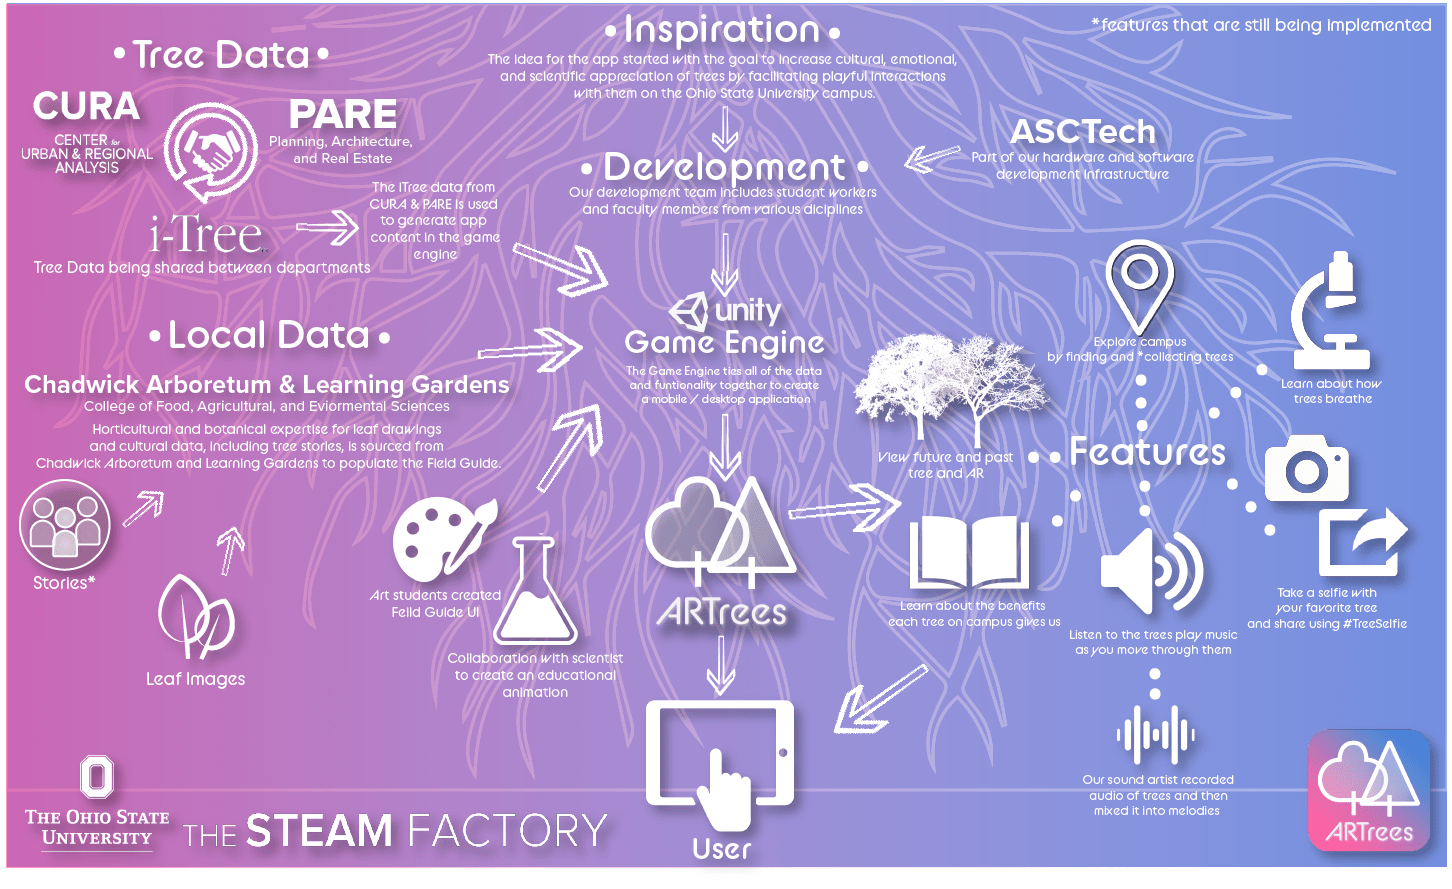
Here is a visualization of how our app works!
It shows who we collaborate with, how the data and work flows as well as showing some of the apps key features.
Splash Screen
Here is the latest splash screen for our app, this will play upon opening and loading the application.
Land Acknowledgement
Our work in developing an app that highlights trees on the Ohio State University has brought us into conversations about the historical trees here, as well as the history of the land the university sits upon. We felt it appropriate to acknowledge the indigenous people who once called this land their home. With the recommendations of the Office of Student Life Multicultural Center, we will be including this land acknowledgement into our app.
“The Ohio State University is situated on the traditional homelands of the Shawnee, Delaware, Miami and Wyandot Nations. We acknowledge the painful history of genocide and forced removal from this territory, and we honor and respect the 45 Indigenous Nations that continue to connect with this land today”.