 Transforming the fracking industry’s chemical disclosures into a usable resource

FracFocus.org is the de facto vehicle for chemical disclosures in the US fracking industry. Unfortunately, this industry-sponsored website provides the data in poorly organized and error-laden formats. I developed code and analysis to transform the raw FracFocus data into a usable research data set. The code and data sets are published at CodeOcean. I periodically compile updated data sets and catalogs.

Transforming Oil & Gas data
I assisted with data wrangling at FracTracker.org. These data analysis and mapping projects tackled gas, oil and even coal data for Ohio, Pennsylvania, West Virginia, Kansas, Oklahoma, Kentucky and North Dakota and focused on a range of issues including production, water use, waste streams and injection wells. My contribution to these analysis projects was primarily web scraping, data cleanup and reconfiguring to formats used in GIS. Some of the code I developed is at Github.
 Exploring the functions of biodiversity

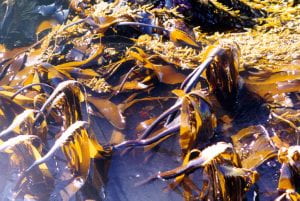
My dissertation focused on the issue of the ecological impacts of loss of biodiversity. I performed a diversity manipulation in a rocky intertidal community in Oregon and documented the resistance and resilience responses of the community to some stresses. In general, I found that resistance was either idiosyncratic or highly dependent on the most abundant species. In addition, I used computer simulations to investigate the robustness of experimental designs purporting to test biodiversity effects. This work demonstrated that effective biodiversity manipulations are complicated and particularly susceptible to misinterpretation.
 Documenting region-wide biodiversity of the rocky intertidal

I worked as Science Coordinator for a multi-university effort to understand the dynamics of intertidal and nearshore communities of the US Pacific Coast (PISCO). As part of that effort, I supervised a 5-year, annual survey of rocky intertidal biodiversity stretching from San Diego to northern Washington. This survey provided unprecedented documentation of multi-scale, multi-zone patterns for hundreds of invertebrates and algal species. These data have been used to study latitudinal gradients of diversity and community saturation, and have been the impetus for several ongoing initiatives within PISCO.
 Exploring the disturbance dynamics of mussel beds on the Oregon Coast

In a collaboration of labs at Oregon State University and Princeton University, we followed the disturbance dynamics of one of the largest landscape elements in rocky intertidal communities: mussel beds. The incredible spatial and temporal variability of disturbance and recovery led us to models of oceanographic-intertidal coupling and network theory to explain the patterns.
 Modeling salmon survival

I assisted in an effort to model the survival of young Atlantic salmon migrating down the Connecticut River using known physical and biological parameters and a spatially-explicit, individual-based model. The model was used to explore the influence of dams on migration mortality.
 Investigating the feasibility and design of marine protected areas

I’ve worked on several studies of marine reserve review, design and implementation. When interest was just developing in using reserves to conserve species and habitat, my colleagues and I published a review of the novel problems and promise of marine reserves. I was a participant in the working group at the National Center for Ecological Analysis and Synthesis on “Developing the Theory of Marine Reserves.” There, I led the effort to address the influence of ‘catastrophes’ on effectiveness of reserves.
 Building skills with custom software

Beyond using programming for analysis and data manipulation projects, I have often built tools to help develop user skills. While I was at Oregon State University, I developed a program to train individuals to accurately estimate visual percent cover in intertidal surveys (“BiasBlaster”) that was used by survey teams in several labs. I also coded a marine algae identification trainer for our biodiversity survey team. More recently, I’ve developed a training framework that I have used for visually identifying mathematical and statistical patterns and to increase data science coding fluency.
 Using Jupyter

I use Jupyter (usually with Python) regularly to test ideas I have, to explore statistical patterns that I want to understand better or to develop preliminary analysis before I move it to full-blown code systems. Here are some examples: Central Limit Theorem, the Law of Small Numbers, confidence intervals and bootstrapping, an exploration of COVID-19 data.
Some other coding projects:
Reformat manual survey data to facilitate analysis

I used code to collate and compile a data set that was collected from manual analysis of an extensive photo library. These data were used to analyze spatial dynamics of macroalgal communities.
Revamp the data of a longitudinal health survey

I helped Women’s Health researchers at Penn State University clean up, reorganize and analyze the Tremin Trust Database. This data set, the largest of its kind, is a 65-year longitudinal survey of menstruation records.
Provide custom front-end to Federal websites

I built a work-flow tool for an OSU professor to help navigate and collect documents from the Unified Agenda Search of the Federal government. The system compiled sets of timelines of EPA rules as they grind through proposed changes and displayed as a simple locally-served static website.
Use Google Map API to compare traffic patterns

I used Google’s API to monitor traffic speeds of three commute corridors in Columbus, OH after the city installed a ‘road diet’ on one of the roads.