By: Bob Nielsen, Purdue University
The grain fill period begins with successful pollination and initiation of kernel development, and ends approximately 60 days later when the kernels are physiologically mature. During grain fill, the developing kernels are the primary sink for concurrent photosynthate produced by the corn plant. What this means is that the photosynthate demands of the developing kernels will take precedence over that of much of the rest of the plant. In essence, the plant will do all it can to “pump” dry matter into the kernels, sometimes at the expense of the health and maintenance of other plant parts including the roots and lower stalk.
A stress-free grain fill period can maximize the yield potential of a crop, while severe stress during grain fill can cause kernel abortion or lightweight grain and encourage the development of stalk rot. The health of the upper leaf canopy is particularly important for achieving maximum grain filling capacity. Some research indicates that the upper leaf canopy, from the ear leaf to the uppermost leaf, is responsible for no less than 60% of the photosynthate necessary for filling the grain.
Kernel development proceeds through several distinct stages that were originally described by Hanway (1971) and most recently by Abendroth et al. (2011). As with leaf staging protocols, the kernel growth stage for an entire field is defined when at least 50% of the plants in a field have reached that stage.
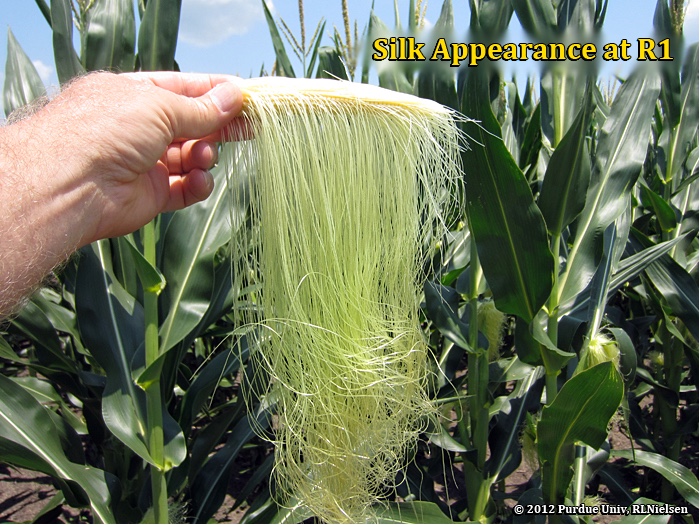
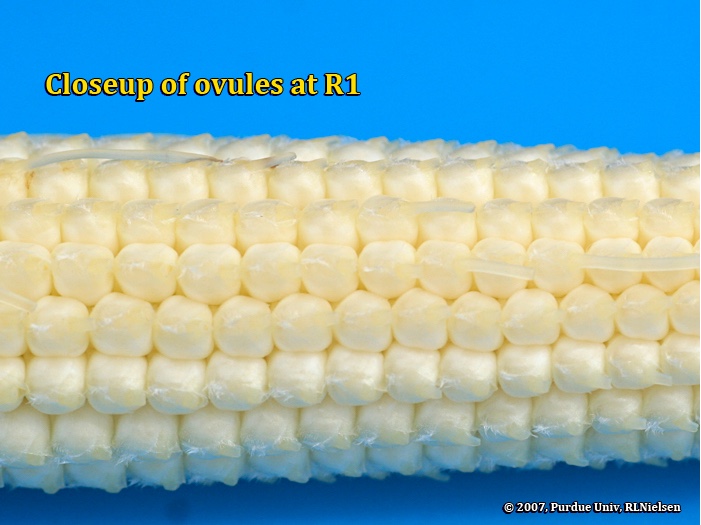
Silking Stage (Growth Stage R1)
Silk emergence is technically the first recognized stage of the reproductive period. Every ovule (potential kernel) on the ear develops its own silk (the functional stigma of the female flower). Silks begin to elongate soon after the V12 leaf stage (12 leaves with visible leaf collars), beginning with the ovules near the base of the cob and then sequentially up the cob, with the tip ovules silking last. Consequently, the silks from the base half of the ear are typically the first to emerge from the husk leaves. Turgor pressure “fuels” the elongation of the silks and so severe drought stress often delays silk elongation and emergence from the husk leaves. Silks elongate about 1.5 inches per day during the first few days after they emerge from the husk leaves. Silks continue to elongate until pollen grains are captured and germinate or until they simply deteriorate with age.
Silks remain receptive to pollen grain germination for up to 10 days after silk emergence (Nielsen, 2016b), but deteriorate quickly after about the first 5 days of emergence. Natural senescence of silk tissue over time results in collapsed tissue that restricts continued growth of the pollen tube. Silk emergence usually occurs in close synchrony with pollen shed (Nielsen, 2016c), so that duration of silk receptivity is normally not a concern. Failure of silks to emerge in the first place (for example, in response to silkballing or severe drought stress) does not bode well for successful pollination.
Pollen grains “captured” by silks quickly germinate and develop pollen tubes that penetrate the silk tissue and elongate to the ovule within about 24 hours. The pollen tubes contain the male gametes that eventually fertilize the ovules. Within about 24 hours or so after successfully fertilizing an ovule, the attached silk deteriorates at the base, collapses, and drops away. This fact can be used to determine fertilization success before visible kernel development occurs (Nielsen, 2016a).
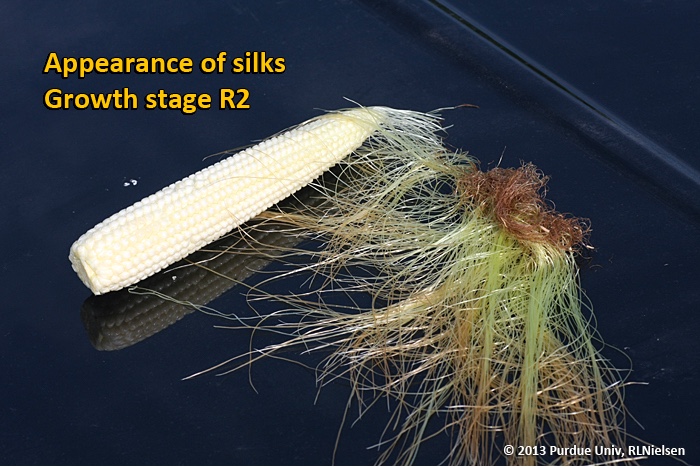
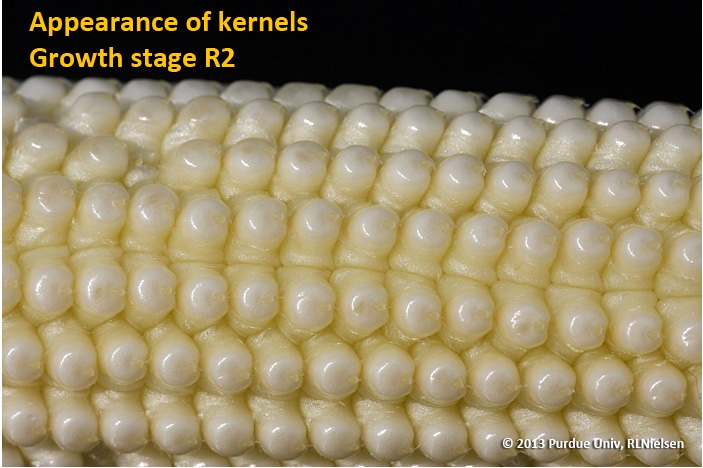
Kernel Blister Stage (Growth Stage R2)
About 10 to 12 days after silking, the developing kernels are whitish “blisters” on the cob and contain abundant clear fluid. The ear silks are mostly brown and drying rapidly. Some starch is beginning to accumulate in the endosperm. The radicle root, coleoptile, and first embryonic leaf have formed in the embryo by the blister stage. Severe stress can easily abort kernels at pre-blister and blister stages. Kernel moisture content at the beginning of R2 is approximately 85 percent. For late April to early May plantings in Indiana, the thermal time from blister stage to physiological maturity is approximately 960 GDDs (Brown, 1999).
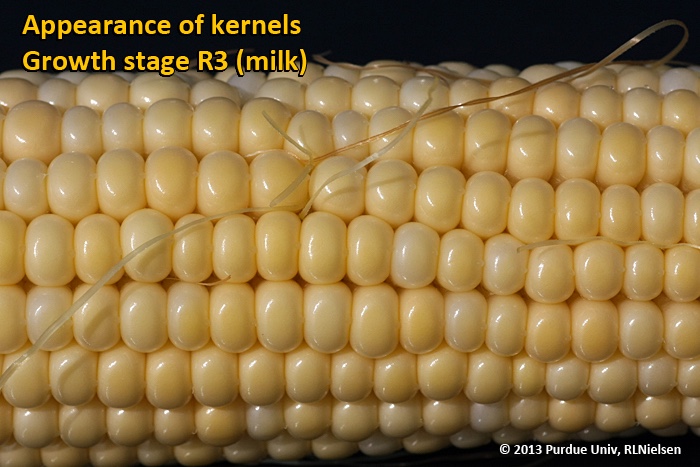
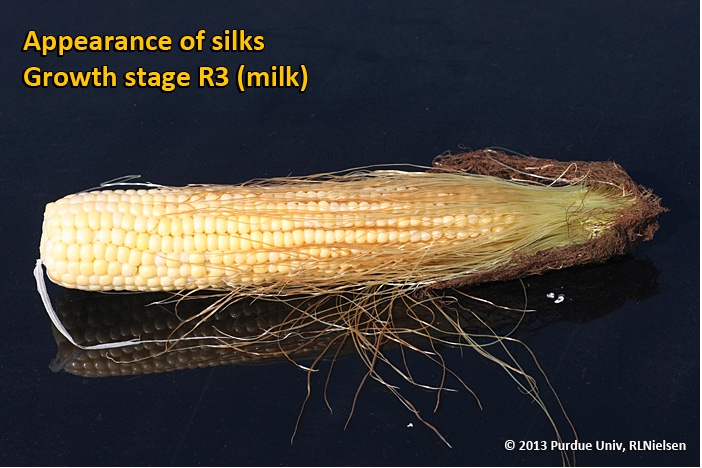
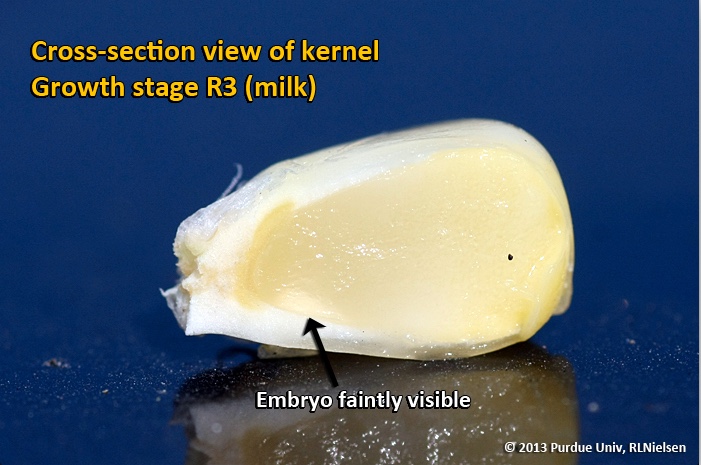
Kernel Milk Stage (R3)
About 18 to 20 days after silking, the kernels are mostly yellow and contain “milky” white fluid. The milk stage of development is the infamous “roasting ear” stage, when you will find die-hard corn aficionados standing out in their field nibbling on these delectable morsels. Starch continues to accumulate in the endosperm. Endosperm cell division is nearly complete and continued growth is mostly due to cell expansion and starch accumulation. Severe stress can still abort kernels, although not as easily as at the blister stage. Kernel moisture content at the beginning of R3 is approximately 80 percent. For late April to early May plantings in Indiana, the thermal time from milk stage to physiological maturity is approximately 880 GDDs (Brown, 1999).
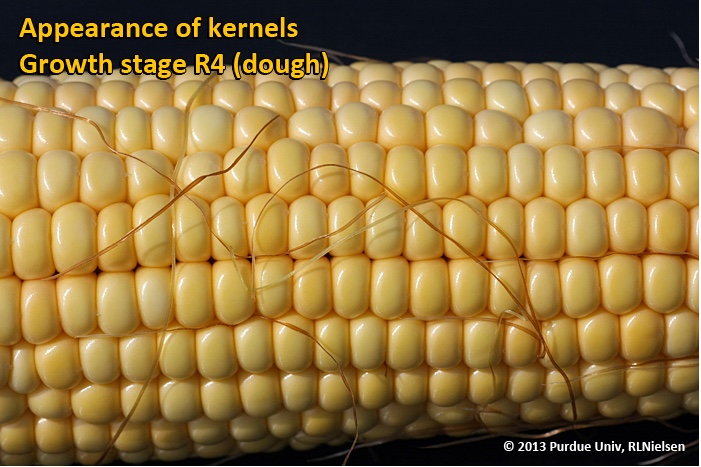
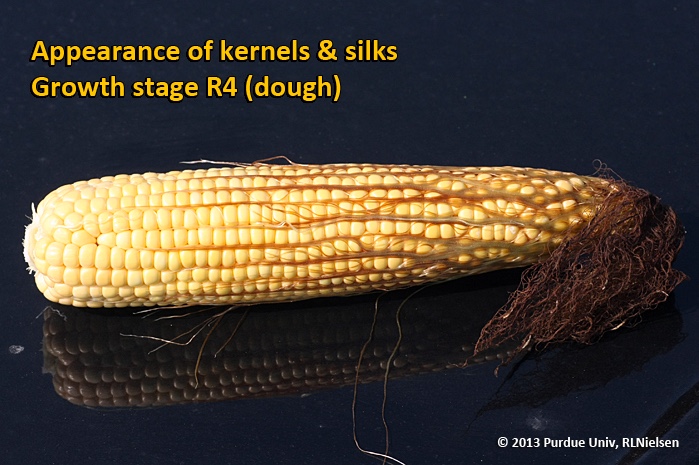
Kernel Dough Stage (R4)
About 24 to 26 days after silking, the kernel’s milky inner fluid begins changing to a “doughy” consistency as starch accumulation continues in the endosperm. The shelled cob is now light red or pink. By dough stage, four embryonic leaves have formed and the kernels have reached about 50 percent of their mature dry weight. Kernel moisture content is approximately 70 percent at the beginning of R4. Near the end of R4, some kernels will typically be starting to dent. Kernel abortion is much less likely to occur once kernels have reached early dough stage, but severe stress can continue to affect eventual yield by reducing kernel weight. For late April to early May plantings in Indiana, the thermal time from dough stage to physiological maturity is approximately 670 GDDs (Brown, 1999).
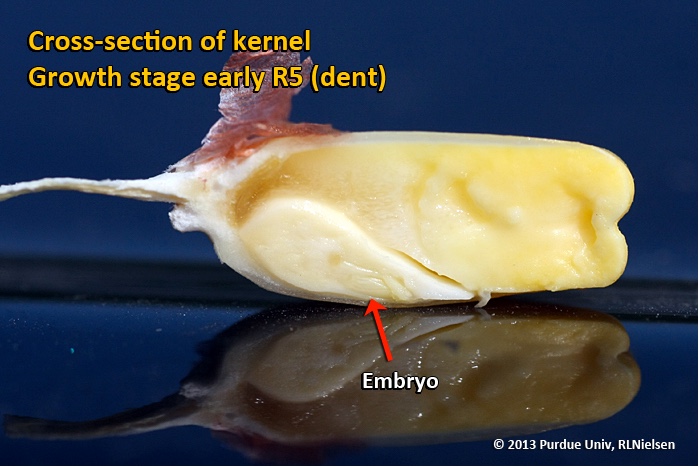
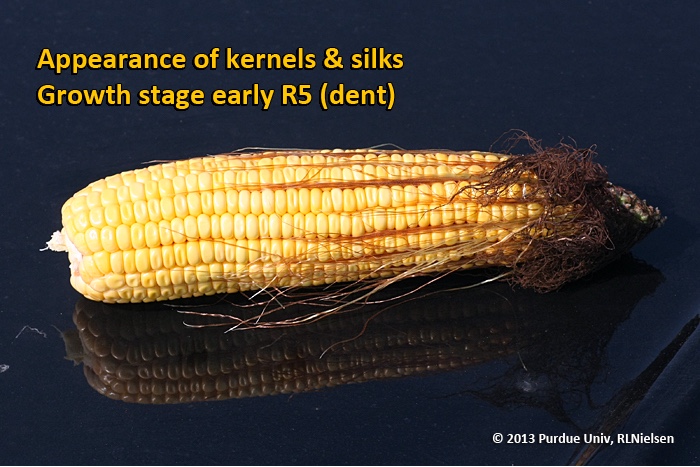
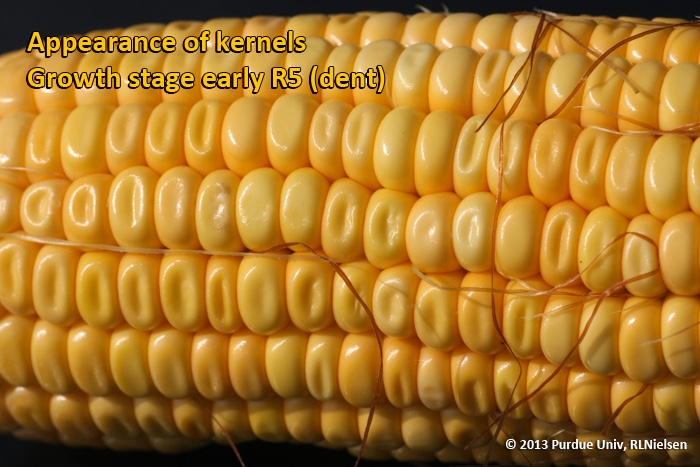
Kernel Dent Stage (R5)
About 31 to 33 days after silking, all or nearly all of the kernels are denting near their crowns. The fifth (and last) embryonic leaf and lateral seminal roots form just prior to the dent stage. Kernel moisture content at the beginning of R5 is approximately 60 percent.
More importantly, kernel dry matter content at the beginning of R5 is only about 45% of the eventual final accumulation and there remains approximately more 30 days before physiological maturity occurs. This is sobering considering that farmers and agronomists alike often breathe a sigh of relief when the crop reaches R5 because of a mistaken and, frankly, emotional belief that the “crop is made” by this grain fill stage.
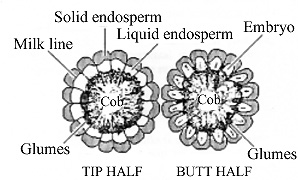
Description of the corn ear.
Interesting Exercise:
You can get a sense of the importance of the final 30 days of grain filling by calculating a number of “what-if” grain filling scenarios using the traditional pre-harvest yield estimation formula for corn with a range of kernel weight “fudge factors” from about 65 to 105 (representing kernel weights equivalent to 65,000 to 105,000 kernels per 56-lb bushel.)
Within about a week after the beginning of R5, a distinct horizontal line appears near the dent end of a split kernel and slowly progresses to the tip end of the kernel over the next 3 weeks or so. This line is called the “milk line” and marks the boundary between the liquid (milky) and solid (starchy) areas of the maturing kernels.
For late April to early May plantings in Indiana, the thermal time from full dent (kernel milk line barely visible) to physiological maturity is approximately 350 GDDs (Brown, 1999). Thermal time from the half-milkline stage to physiological maturity for similar planting dates is approximately 280 GDDs. One of the consequences of delayed planting is that thermal time from the dent stage to physiological maturity is shortened, though this may simply reflect a premature maturation of the grain caused by the cumulative effects of shorter daylengths and cooler days in early fall or by outright death of the plants by a killing fall freeze.
Severe stress can continue to limit kernel dry weight accumulation between the dent stage and physiological maturity. Estimated yield loss due to total plant death at full dent is about 40%, while total plant death at half-milkline would decrease yield by about 12% (Carter & Hesterman, 1990).
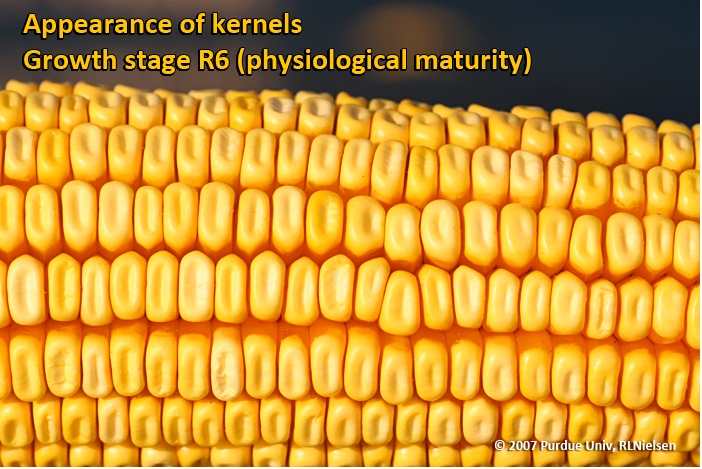
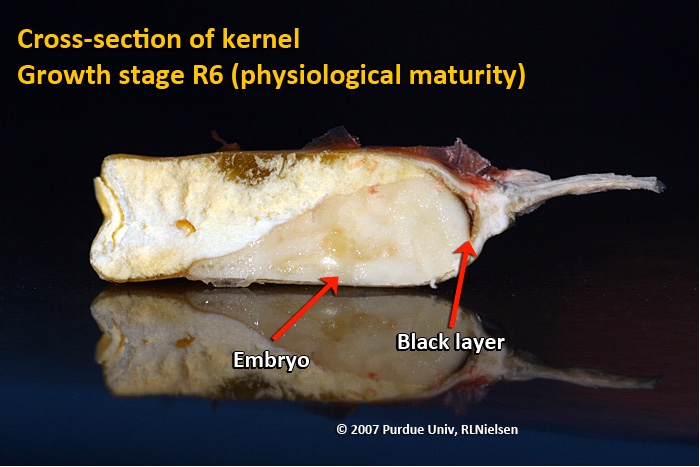
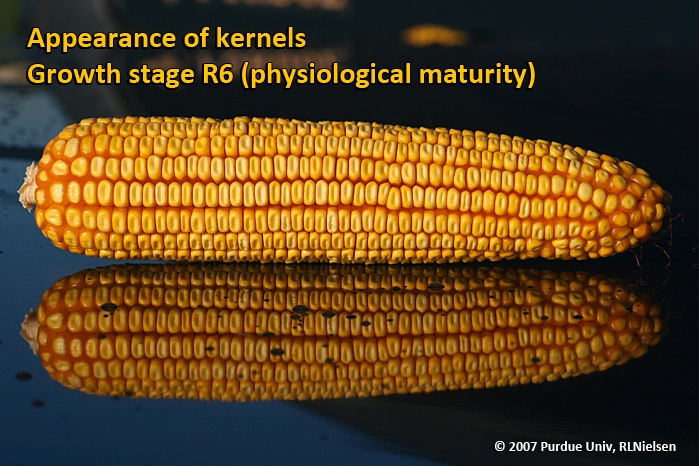
Physiological Maturity (R6)
About 55 to 65 days after silking, kernel dry weight usually reaches its maximum and kernels are said to be physiologically mature and safe from frost. Physiological maturity occurs shortly after the kernel milk line disappears and just before the kernel black layer forms at the tip of the kernels. Severe stress after physiological maturity has little effect on grain yield, unless the integrity of the stalk or ear is compromised (e.g., damage from European corn borer or stalk rots). Kernel moisture content at physiological maturity averages 30 percent, but can vary from 25 to 40 percent grain moisture depending on hybrid and growing conditions.
Harvest Maturity
While not strictly a stage of grain development, harvest maturity is often defined as that grain moisture content where harvest can occur with minimal kernel damage and mechanical harvest loss. Harvest maturity is usually considered to be near 25 percent grain moisture.