Using VLOOKUP and INDEX MATCH Formulas

Picture of Ren Leaflight       Picture of Baby Using Computer to Symbolize Savvy Rating

VLOOKUP Function

As an intermediate Excel user, you have probably used the VLOOKUP function in Excel to match data between two different tables.  VLOOKUP is legitimately a great function with lots of uses.  For example, you can match the budget information in one table with department information in another using the common department number.  The formula itself is pretty straight forward:

VLookup general formula


Lookup value:  This is the cell number of the data you want to use to match.  In the example below, this is the department number in cell A3.

Region with data:  This is the range of the table with the data to be matched.  The leftmost column must be the one you want to search for a matching value. In the example below, we start with A7 and go to D18.

Column index for return data: This is an index number for the column with the data you want returned.  The first column in the region you selected is 1, the second column is 2, and so on.  In our example, we want the value in the 3rd column to be returned.

Match type: This number tells Excel how you want to match.  “0” means only return an exact match.  You will almost always want to use 0.

Formula for VLOOKUP example


Results

Results from the VLookup formula


Note that if there is no match, the formula returns an error so you might want to enclose VLOOKUP in the IFERROR function:

Enclosing VLookup in IFERROR formula


Downsides of the VLOOKUP Function

As great and powerful as the VLOOKUP function is, it does have some downsides.  It can only return a value that is to the right of the column that contains the lookup values. In our example, we can lookup up the Department name using the Department number, but we couldn’t do the reverse.  Also, if your table is a work in progress (and they usually are), you might want to add a new column.  When the new column is added, it can shift the index number you used to get your return value and presto your formula is broken.

INDEX & MATCH Function

There is a solution to these issues.  Using the INDEX and MATCH formulas together is little more complicated that VLOOKUP, but not terribly so and it is a lot more versatile.  Let’s break it down.

General formula for Match


The MATCH function returns a relative position for data that matches the lookup value you give it.  We want it to return the relative row number from the lookup column.  We only want an exact match to be returned so the match type should be 0.

Specific Match formula for example


So far MATCH is a lot like VLOOKUP, the only difference is it will return only the relative position, not the value in the cell.  Since we want the actual value in the cell, we wrap MATCH in a function called INDEX.  INDEX returns the value in a cell when given its relative position.

General Index Formula


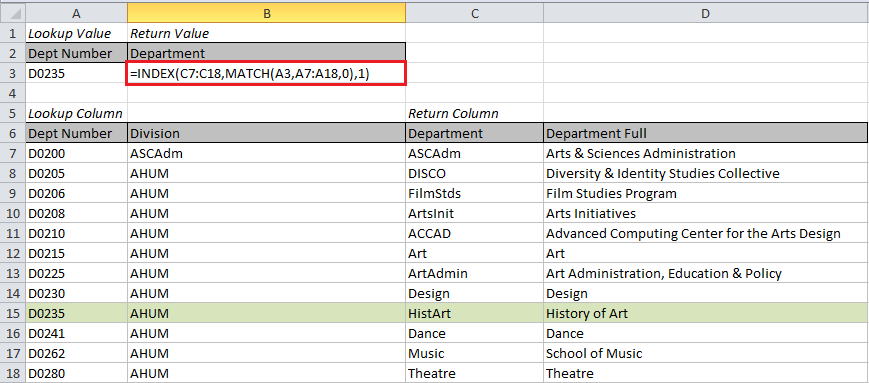
For our purposes, there are three parts to the INDEX function:  return column, relative row number, and relative column number.  Return column is straight-forward, this is the same as with VLOOKUP. We just figured out the relative row number with our MATCH formula above. Since we are only giving INDEX one column, the relative column number will be 1.  Voila we have the final formula!

Index Match Formula for Example


This combination of INDEX and MATCH is a lot clearer about where the return data is located than VLOOKUP.  Instead of a relative column number, you have the actual column written out.  It also becomes easier to copy and paste this formula into more than one column if you want multiple values returned.

Copying Index Match to other columns


I recommend trying the INDEX MATCH combination wherever you would normally use VLOOKUP.  It will save you time and errors in the long run.


eReports – SR Course Models

Ren_SmallSquare                               Picture of Earth to Symbolize Global Rating

An integral part of being data savvy here at OSU is using the Hyperion eReports system to pull your own data.  However, people who use these reports infrequently can find them a bit intimidating.  Starting with this blog, I will be discussing the most used eReports and the information you can pull with them in hopes of making these valuable reports a little friendlier.  Today’s topic is the SR Course Models series of reports.

SR Course Models is your main “go to” set of reports for anything to do with course enrollments. You can find out where and when a course is scheduled, the name of the instructor for the course and the current enrollment in the course.  These reports are commonly used to check on wait list and enrollment totals near the beginning of a new term.

To get to the main page of eReports first select the Student_Information_System folder, then the Student_Records folder.  SR Course Models is the fourth item on the menu.

Picture of the Student_Records page


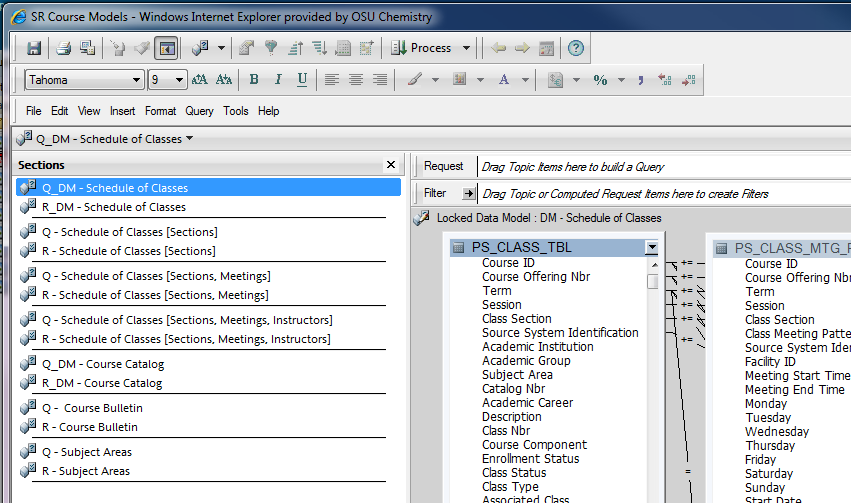
Once you have selected SR Course Models, you have a choice of seven reports.  Two of these, Schedule of Classes and Course Catalog are “blank slate” queries that you can use to build your own view of the data; we won’t discuss them here.

Picture of the SR Course Models page

Three of the reports – Schedule of Classes [Sections], Schedule of Classes [Sections, Meetings], and Schedule of Classes [Sections, Meetings, Instructors] – show increasing levels of detail for your courses.

You might use the top level – Schedule of Classes [Sections] to get a quick feel for which classes have wait lists of greater than 10.  Run the report selecting the upcoming term and the subject you are interested in. Then drag the Wait List Total column to the Filter line above the data.  When the selection box pops up, select greater than 10.  The data set will quickly be reduced to your courses with the highest wait lists.

Picture of the Schedule of Classes [Sections]

Once you have a list of each class with a long wait list, maybe you want to check out meeting times to see if there are other meetings for the same course that have no wait list.  You can use Schedule of Classes [Sections, Meeting] with a minor adjustment to get this information.  Before you run the query, first drag Enrollment Total, then Wait List Total to the Request line above the data.  Both of these fields can be found in the PS_CLASS_TBL.

Picture of The Schedule of Classes [Sections, Meeting] page


Run the query and select the Term, Campus, Subject and Catalog Number of the class or classes in question.  When the query finishes running, you may want to drag up the column Course Component to the Filter line and select LEC, LAB, REC, etc. depending on your needs.  The filter line can help you narrow down your view to pinpoint exactly the courses you want to view.

Perhaps now you want to know the instructors for the various sections of the course.  You can run Schedule of Classes [Sections, Meeting, Instructors] to get the instructor names for each of the meeting times.  Run the query the same way you did the last one selecting Term, Campus, Subject and Catalog Number.  This time you may want to drag Instructor Role to the Filter line and select PI to get only the primary instructors.  Additionally, dragging Print Instructor in Schedule to the Filter line will help you narrow the search down even more.

Picture of Schedule of Classes with Instructor Role


The other reports in SR Course Models are the Course Bulletin and Subject Areas.  Course Bulletin is a quick way to pull up course descriptions, credit hours, career, and CIP codes.  This report runs very quickly and it is easy to drag the Subject to the Filter line after it runs if you only want to see the courses for one department or subject.

Pciture of filtering by subject


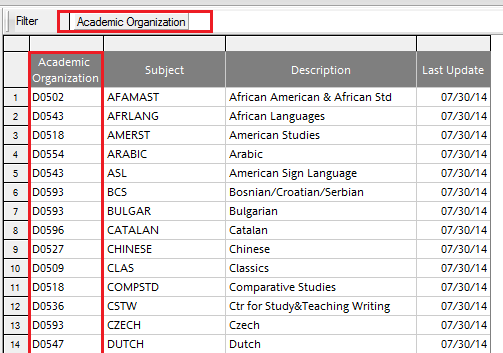
The Subject Areas report show the subjects that are owned by each Academic Organization (a.k.a. D Org).  It gives the standard abbreviation for the subject as well as a full description.  I find it helpful to filter this by the first few characters of the Academic Organizations. For example, I might choose to look at all the D Orgs beginning with D05 for Humanities or D07 for Social and Behavioral Sciences.  Whatever your filter, the report automatically gives you the most up to date view of subjects and owners.

Picture of filtering by Academic Organization


There is a lot you can do with the SR Courses Models reports, especially the Schedule of Classes reports.   I’m sure many of you may have your own favorite use for them.  I would be very interested to hear about your experiences and any tricks you have to make the most of them so please do chime in.