Last summer, President Obama announced that a complete DEM of the Arctic will be completed by next year. The ArcticDEM will be a continous, 8m and then 2m DEM mosaic of all land masses above 60 degrees North (above the latitude of SRTM), constructed from DigitalGlobe Inc. satellite imagery. SETSM is the primary software for DEM extraction for ArcticDEM and we have been working feverishly to ramp up data processing on the Blue Waters Supercomputer while simultaneously continuing SETSM development and post-processing, mosaicking and registration methods. Nearly all of Alaska, Greenland, Scandanavia and large parts of Russia and Canada have already been processed to 8m. This enables data filtering and algorithm development. Once complete, the resolution will be increased to 2m for the final product.
Uncategorized
NSF Funds SETSM Development and Software-As-A-Service on XSEDE
The National Science Foundation has awarded our team $400K over two years as part of the Polar Cyber-infrastructure Program to further develop and optimize SETSM and implement SESTM as a “Software-As-A-Service” on the NSF’s eXtreme Science and Engineering Discovery Environment (XSEDE) high-performance computing network. This grant will also fund the open source release of SETSM.
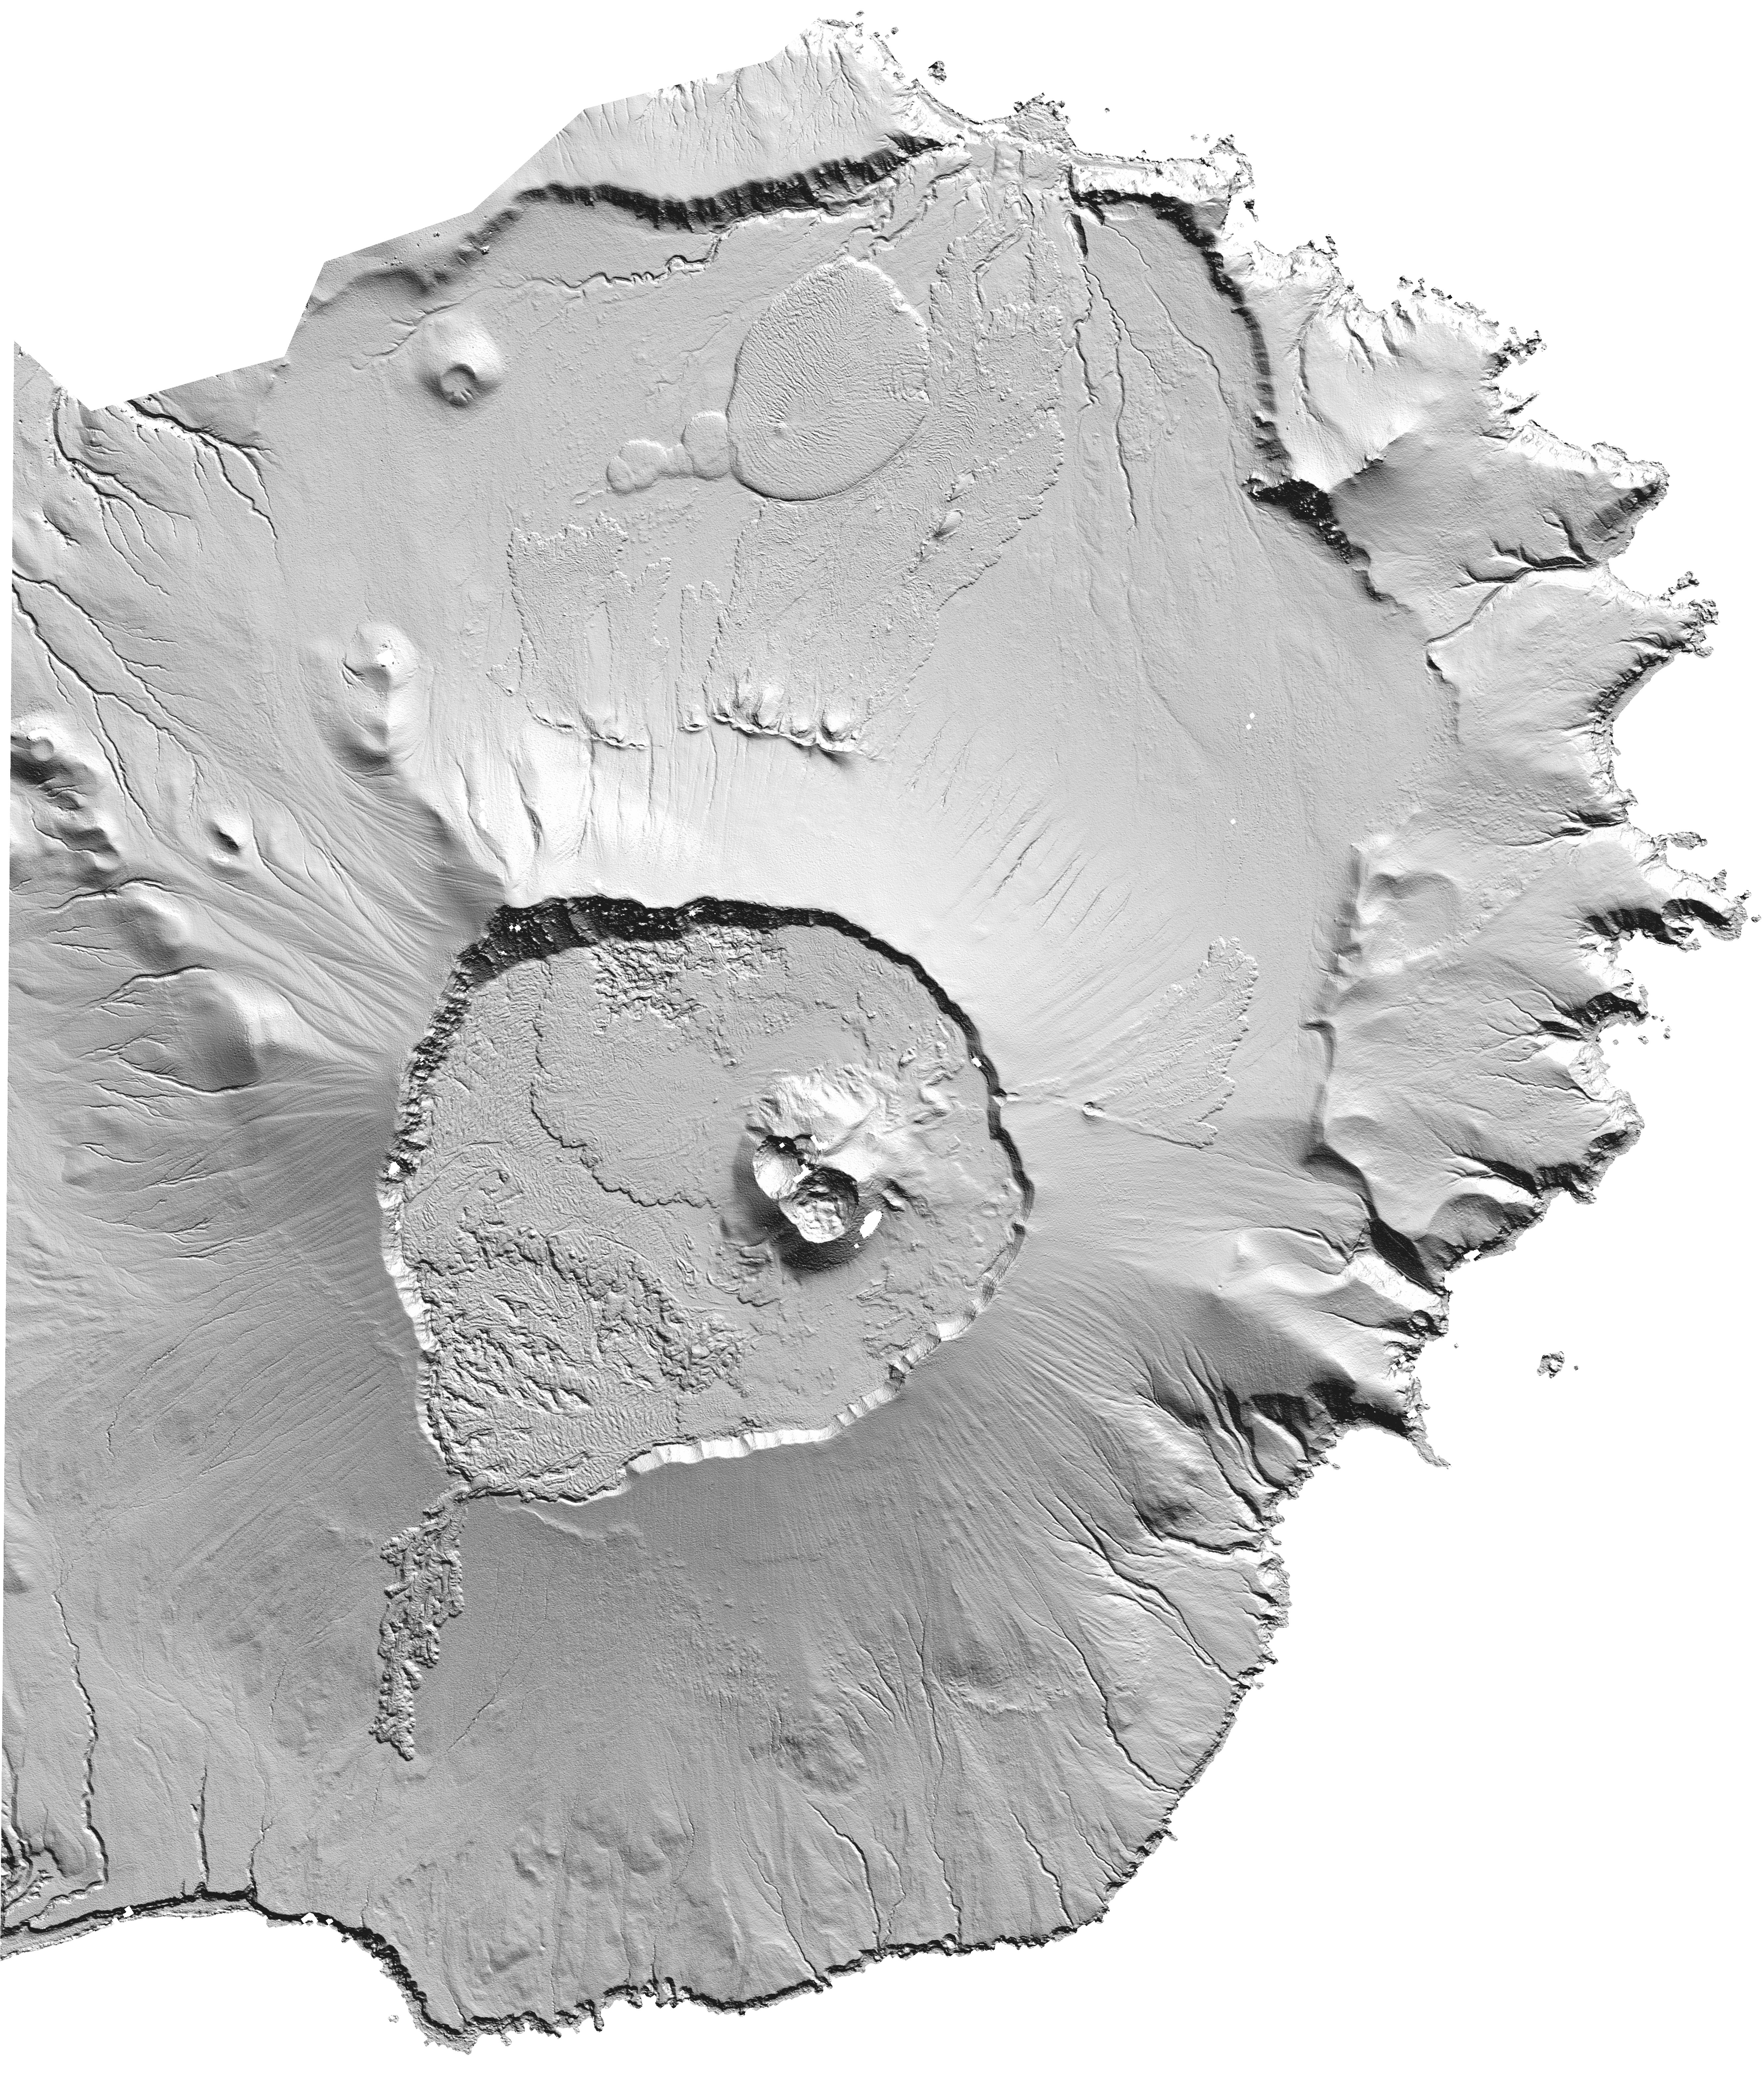
Yunaska Volcano, Aleutian Islands
A good example of the detail SETSM is able to recover from WorldView stereo imagery over bare surfaces is shown at the the Yunaska Volcano in the Aleutian Island Chain, shown below. Download the image to explore the lava flows and crater a full resolution (2 meters). This DEM was created fully automatically, with no seed DEM or tuning of settings. The filtering for surrounding water and clouds was also automatic (based on matching point density and morphology).
Barnes Ice Cap Registered DEM
The Barnes Ice Cap on Baffin Island, Canada has been rapidly shrinking for decades. In order to test our ability to automatically construct registered DEM mosaics, we built a complete , 10-m posting DEM of the Barnes using WorldView 1 and 2 imagery from the spring/summer of 2011, close in time to a LiDAR survey by NASA’s Operation IceBridge. Some manual quality control was performed to mask clouds. The DEM was three-dimensionally registered to the LiDAR survey. The resulting mosaic has a 1-sigma error of 0.4 m compared to the LiDAR (which itself has an accuracy of 0.2 m). A hill shade representation of the resulting DEM mosaic at 5x vertical exaggeration is shown below. Visible are dendritic networks of meltwater channels beneath the snow extending from the ice divide.

Nepal Processing Update
Thanks to the Ohio Supercomputer Center, we were able to process the entire WorldView stereo image inventory over Nepal. As before, these are being distributed through the Polar Geospatial Center. We are continuing to process data as they arrive and hope to have some pre/post event comparisons to show soon.

Google Earth image overlain with hillshade representations of the DEM’s that have been produced to date and are available at the PGC.