 Agricultural producers are constantly looking for ways to reduce their input cost as a means to stabilize production cost. As energy prices fluctuate and the price of PV (photovoltaic) solar energy continues to fall, more and more farmers are investigating the economics of a PV solar system to generate electricity for their farm. Investing in an on-farm solar system can reduce the amount of electricity a consumer purchases from their electric utility provider, minimizing the impact of future price fluctuations. However, each project is different due to variables such as: energy consumption, energy cost, utility provider, rate schedule and tariffs, system design, components, warranties, and contracts.
Extension educators have a long history of identifying critical issues facing our clientele and providing factual-based information to guide informed decisions. A growing question among many Ohio farmers is, “What is the payback period for a Photovoltaic (PV) solar system on my farm?” Investing in on-farm PV solar typically requires a significant upfront investment that will involve numerous contracts, spanning decades. It is important that anyone considering a PV solar proposal conducts a detailed assessment before signing any paperwork and not fall victim to making a hasty decision.
Below are four tips that will help Extension clientele evaluate a PV solar proposal and the associated impacts of the project to their farm.
Tip # 1 – Understand the details of a proposal:
Proposals for PV solar systems frequently involve numerous contracts and are often difficult to understand. If necessary, ask the developer to put the information in a format that you can understand. The cost of the system (equipment and labor) should be easy to identify and not masked by various tax credits, grants and subsidies to the point it is unclear exactly the project cost. Many PV solar system proposals make it appear as if after all of the financial benefits are assumed, a system can be installed for $5,000 to $10,000 to provide all of the energy for a facility. It is important to remember that although there are financial incentives for renewable energy projects, many of them are in the form of tax credits, depreciation, and energy savings not recognized until after the project is operational. In other words, if the project cost is $100,000, then the owner of the project will need to pay the renewable energy developer $100,000 to install the system.
When reviewing a proposal, make sure to clearly identify the assumptions and/or projection details. Some common assumptions and/or projection details to look for include:
- What is the factor used to calculate the electricity price escalation?
- Are competitive grants included in the payback calculation (i.e., a grant that is not guaranteed to be funded)?
- What inflation rate and discount rate is used?
- Does the cash flow analysis look at all items on an after-tax basis (e.g., annual electric expense)?
- Does the analysis include additional cost for insurance?
- Does the analysis include additional cost operation and maintenance?
- Does the analysis account for degradation of the panels over time?
Similar to other large capital investments, it is a good idea to secure multiple quotes to identify a company that demonstrates experience in PV solar installations and the local electric utility interconnection process. Green Energy Ohio, a non-profit corporation, has lists of Ohio installers.
Tip #2 – Talk with the utility provider:
Net metering is a billing arrangement allowing customers that produce their own electricity to receive a credit on their electric utility bills for any extra electricity produced by their system that flows back onto the electric utility’s distribution system, and the credit can be used to offset charges in future months. Interconnecting a PV solar system to the distribution grid may present a number of technical issues and challenges that a system owner should discuss with the utility provider before agreeing to install a system.
In addition to the technical challenges, electric bills can be difficult to understand making it hard to evaluate the true impact of a PV solar system on a farmer’s electric bill. In Ohio, a net metering credit is limited to kilowatt-hour (kWh) charges only and will not reimburse system owners for distribution services, transmission services or demand meter charges. In other words, even if a PV solar system generates all of the electricity for a farm, there may still be additional monthly charges that will remain on the system owner’s electric bill. When estimating the electricity savings in a PV solar proposal, it is important to make sure to identify any charges that will remain on the bill and remove them from the equation. It is a good idea to personally contact the local electric utility provider (not communicate through a third party) to review the PV system proposal with them and understand the impact on the electric bill. A list of utility contacts can be found on the Public Utilities Commission of Ohio (PUCO) website.
Tip #3 – Research Solar Renewable Energy Credits:
In 2008 Ohio established alternative portfolio standards that require Ohio’s electric distribution utilities or electric services companies to diversify their electricity generation to include 12½% renewable energy by 2027. Utilities that do not meet the annual benchmarks for renewable generation are subject to compliance payments. However, to comply with the requirement electric distribution utilities or electric services companies can purchase renewable energy credits from other renewable energy producers. Every time a certified renewable energy facility system generates one-megawatt hour of electricity, it also generates one renewable energy credit. A renewable energy credit that is created by solar energy is known as a Solar Renewable Energy Credit (SREC). An electronic database tracks the amount of electricity generated by a solar energy system and the corresponding creation of renewable energy credits. The most common database used to track renewable energy credits in Ohio is the Generation Attribute Tracking System (GATS). There is no assigned value to an SREC, as the prices are influenced by renewable energy policy, supply and demand. For example, in Ohio the GATS solar weighted average price per certificate reached a high price of $471 in 2010 and a low price of $85 in 2015.
The sale of SRECs can generate significant income for system owners, which can help offset the high upfront installation cost. There are a number of different ways a system owner can sell their SRECs. For example, the owner of a system may choose to personally manage the sale of their SRECs as they are generated via a web-based exchange program, enter into an agreement to sell their SRECs to an aggregator or broker, or sell their SRECs directly to the system developer who built their system.
Some PV solar proposals will try to oversimplify the transaction of SRECs by calling it a discount, rebate, payment, allowance or refund. Regardless of what you call an SREC agreement, the value of these agreements is significant, and the terms can extend for 20 years or more. In addition, the sale of an SREC is a taxable transaction and the sale proceeds will be taxed as ordinary income. If a system owner agrees to receive money upfront for the rights to their SRECs, there will typically be a contract associated with the agreement. The complexity of the agreements can vary significantly and it is essential that you receive a copy of the contract before signing any paperwork. Additional information on renewable energy credits is available here.
Tip #4 – Conduct a detailed financial analysis:
It requires a significant capital investment to develop a PV Solar system that should undergo a detailed financial analysis. In many cases, project developers will present a farmer with a summary sheet that shows a simple payback calculation for the project. However, using a simple payback calculation to assess the economic feasibility of a PV solar project has major limitations. The simple payback calculation ignores critical investment factors such as the time value of money, variations in energy prices and alternative investment options. In addition, many of the small details and various assumptions discussed in Tip # 1 above should also be included in a detailed financial analysis.
On-farm PV solar proposals are wide-ranging, complex, and challenging to evaluate in terms of performance and probability. A good practice is to review the proposal with an accountant or financial advisor who can assist in utilizing multiple financial analysis tools (e.g., net present value, Discounted Cash Flow, Internal Rate of Return) to help accurately forecast the future financial performance of a project. In addition, the National Renewable Energy Laboratory of the U.S. Department of Energy has developed cash flow models to help calculate the levelized cost of energy, net present value, payback period, and other financial metrics related to a renewable energy project.
For additional farm-energy resources, please visit go.osu.edu/farmenergy and extension.org/ag_energy.
(Submitted by Eric Romich, Assistant Professor and Extension Field Specialist for Energy Development)


 Oil and gas development in the region may be a catalyst for the growth of organized giving in this part of the state where shale development is occurring. New community foundation funds have been established in
  Extension researchers recently shared the highlights of an advanced cluster analysis focused on manufacturing with community development officials in four EDD’s (economic development districts) within the eastern Ohio shale play. The cluster analysis is one of four analytical steps being conducted as part of an EDA (Economic Development Administration) funded project to inform the overall 25-county region about economic, social and environmental changes, potential implications and strategic directions for sustainable development.
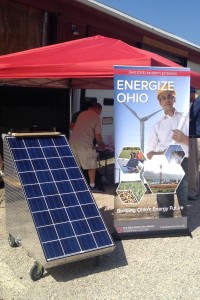 At most any Extension event throughout Ohio, the unit can serve as a teaching tool to demonstrate how PV solar technology works, assist in disseminating renewable energy materials and videos, as well as communicate Extension impacts via short videos. Think about how you might use this demonstration unit at your remote outdoor events, field days, county fairs and 4-H camps where it can power a projector, TV, computer or microphone. As a ready-made charging station for visitors’ cell phones and laptops, the Mobile Solar Unit serves as a great teaching tool at indoor events too.

 According to the 2009 USDA On-Farm Renewable Energy Production Survey, it is estimated there are 115 farms in Ohio that have installed an on-site photovoltaic solar system to generate their own electricity. In response to this growing trend, a team of OSU Extension Educators is currently developing new curriculum materials to provide farmers additional information for on-farm solar applications. The Energize Ohio team has recently started work on a short video series, which contains videos related to renewable energy and energy efficiency applications. Feel free to
 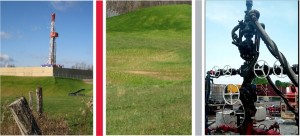 Oil and gas production dates back to the 1800s in eastern Ohio, where thousands of wells have been drilled into shallow sandstone deposits and other formations. Since 2010, however, energy resource development in Ohio has been on a scale far exceeding that of the previous 100 years. The impact on farmers and other rural landowners has been substantial, including payments of hundreds of thousands of dollars for many who have leased their subsurface resources.